


By Tim Ball, Canada Free Press
A sad day for the climate charlatans, but not for science.
Global Warming is often called a hoax. I disagree because a hoax has a humorous intent to puncture pomposity. In science, such as with the Piltdown Man hoax, it was done to expose those with fervent but blind belief. The argument that global warming is due to humans, known as the anthropogenic global warming theory (AGW) is a deliberate fraud. I can now make that statement without fear of contradiction because of a remarkable hacking of files that provided not just a smoking gun, but an entire battery of machine guns.
Someone hacked in to the files of the Climatic Research Unit (CRU) based at the University of East Anglia. A very large file (61 mb) was downloaded and posted to the web. Phil Jones Director of the CRU has acknowledged the files are theirs. They contain papers, documents letters and emails. The latter are the most damaging and contain blunt information about the degree of manipulation of climate science in general and the Intergovernmental Panel on Climate Change in particular.
Climate science hijacked and corrupted by this small group of scientists
Dominant names involved are ones I have followed throughout my career including, Phil Jones, Benjamin Santer, Michael Mann, Kevin Trenberth, Jonathan Overpeck, Ken Briffa and Tom Wigley. I have watched climate science hijacked and corrupted by this small group of scientists. This small, elite, community was named by Professor Wegman in his report to the National Academy of Science (NAS).
I had the pleasure of meeting the founder of CRU Professor Hubert Lamb, considered the Father of Modern Climatology, on a couple of occasions. He also peer reviewed one of my early publications. I know he would be mortified with what was disclosed in the last couple of days.
Jones claims the files were obtained illegally as if that absolves the content. It doesn’t and it is enough to destroy all their careers. Jones gave a foretaste of his behavior in 2005. Warwick Hughes asked for the data and method he used for his claim of a 0.6C temperature rise since the end of the nineteenth century. Jones responded, “We have 25 years or so invested in the work. Why should I make the data available to you when your aim is to try and find something wrong with it?” He has stonewalled ever since. The main reason was because it was used as a key argument in the Intergovernmental Panel on Climate Change (IPCC) Reports to convince the world humans caused rapid warming in the 20th century. The emails obtained are a frightening record of arrogance, and deception far beyond his 2005 effort.
Another glimpse into what the files and emails reveal was the report by Professor Deming. He wrote, “With publication of an article in Science (in 1995) I gained sufficient credibility in the community of scientists working on climate change. They thought I was one of them someone who would pervert science in the service of social and political causes. So one of them let his guard down. A major person working in the area of climate change and global warming sent me an astonishing email that said. “We must get rid of the Medieval Warm Period.” The person in question was Jonathan Overpeck and his even more revealing emails are part of those exposed by the hacker. It is now very clear that Deming’s charge was precise. They have perverted science in the service of social and political causes.
Professor Wegman showed how this “community of scientists” published together and peer reviewed each other’s work. I was always suspicious about why peer review was such a big deal. Now all my suspicions are confirmed. The emails reveal how they controlled the process, including manipulating some of the major journals like Science and Nature. We know the editor of the Journal of Climate, Andrew Weaver, was one of the “community”. They organized lists of reviewers when required making sure they gave the editor only favorable names. They threatened to isolate and marginalize one editor who they believed was recalcitrant.
Total Control
These people controlled the global weather data used by the IPCC through the joint Hadley and CRU and produced the HadCRUT data. They controlled the IPCC, especially crucial chapters and especially preparation of the Summary for PolicyMakers (SPM). Stephen Schneider was a prime mover there from the earliest reports to the most influential in 2001. They also had a left wing conduit to the New York Times. The emails between Andy Revkin and the community are very revealing and must place his journalistic integrity in serious jeopardy. Of course the IPCC Reports and especially the SPM Reports are the basis for Kyoto and the Copenhagen Accord, but now we know they are based on completely falsified and manipulated data and science. It is no longer a suspicion. Surely this is the death knell for the CRU, the IPCC, Kyoto and Copenhagen and the Carbon Credits shell game.
CO2 never was a problem and all the machinations and deceptions exposed by these files prove that it was the greatest deception in history, but nobody is laughing. It is a very sad day for science and especially my chosen area of climate science. As I expected now it is all exposed I find there is no pleasure in “I told you so.”
See more here.
See this excellent summary of the most eggregious examples from the emails by Bishop Hill here.
It includes this one email:
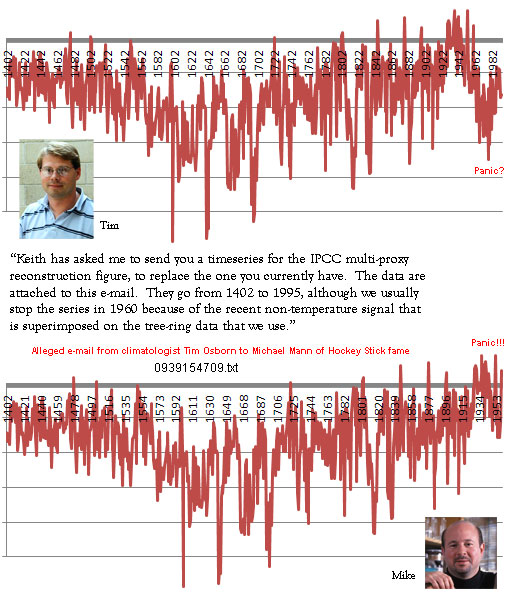
Tim Osborn discusses how data are truncated to stop an apparent cooling trend showing up in the results (0939154709). Analysis of impact here. Wow!
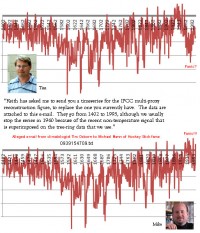
See larger image here.
See some of the responses from Penn State alumni to their administration about Dr. Mann.
First is an email from PSU meteorology grad Herb Stevens who has been in television meteorology at The Weather Channel, in local television in Albany and then throughout the northeast as the “Skiing Weatherman”. Herb serves as a forecaster and advisor to ski areas and golf courses across the country and was a caddy on the PGA tour. See plea at end of letter.
November 23, 2009
Dear Dr. Spanier:
In recent days, nearly a thousand emails from the University of East Anglia Climate Research Unit have been released for public scrutiny. They were obtained either through the actions of a hacker, or an inside whistleblower. While not condoning any illegal activities, I have read most of the emails and have found a good number of them to be very disturbing due to the participation of Dr. Michael Mann of Penn State’s Earth System Science Center. Based on the content of the emails, Dr. Mann, whose scientific methodologies have already been discredited with respect to his “hockey stick” temperature graph, seems to have been involved in an ongoing pattern of data manipulation, intimidation of scientific journal editors, constraint of the peer review process, and attempted avoidance of compliance with the Freedom of Information Act. As a Penn State meteorologist who has been active in the public discussion of climate change for more than ten years, I can attest to the fact that Dr. Mann’s reputation, and by extension that of Penn State, has been significantly sullied in recent years. These new revelations of Dr. Mann’s methods and actions will only exacerbate the situation and serve to darken the shade of the black eye currently sported by the University’s Earth Sciences Department.
In my opinion, Dr. Mann should be relieved of his duties based solely on the deceptive methods used in the creation of the hockey stick. If any of the matters seemingly revealed in the CRU emails have a shred of truth to them, then your course of action should be very simple...Dr. Mann must be terminated from his contract with The Pennsylvania State University.
I sincerely request that you look into this matter, recognizing that Dr. Mann’s presence on the faculty is undoubtedly responsible for a sizable amount of grant money. The money be damned. I would hope that you hold the members of the faculty to the standard so eloquently stated in the 4th verse of our Alma Mater..."May no act of ours bring shame, to ONE heart that loves thy name...May our lives but swell thy fame, Dear old State, dear old State.”
Thank you for your consideration of this matter.
Respectfully,
Herbert E. Stevens
North Kingstown, RI
Meteorology-1975
I appeal to all graduates of Penn State, and especially those of you who studied atmospheric sciences...If you believe as I do that Dr. Mann’s presence on the faculty has become a liability to the reputation of our alma mater, please let your feelings be known to President Graham Spanier. His email address is president@psu.edu. Thank you very much.
Also see this post by another Penn State grad and well known meteorologist Joe Bastardi on Climategate and Mann-made Global Warming here.
Icecap Note: My favorite summary of this issue so far from a friend “This suggests fraud on such a massive scale that its makes Bernie Madoff look like he was robbing convenient stores.” Another meteorological friend, Pete Leavitt, commented on the misdirected attention in some of the media on the whisteblower instead of the fraud. He noted that the job of the media is at times to be whistleblowers but it appears “they swallowed their whistle”. The right of freedom of speech gives them the power to inform and persuade but not the power to compel. When you do so, you cross the line from freedom to tyranny.
The Gore WarBy Art Horn, Icecap
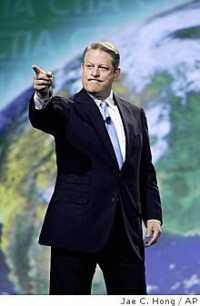
In 2007 Al Gore won the Nobel Peace Prize. I always thought this was strange. What’s the connection between Gore’s climate activism and the Peace Prize? How could a man with no science background write a book and make a movie about how mankind is screwing up the climate and then get a prize for promoting peace? Well it’s beginning to make sense. The Nobel was not a peace prize, it was a war prize.
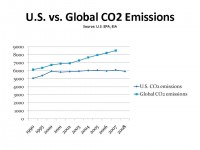
Gore’s message about how dangerous man made global warming is has been heard all over the world over and over and over again. The Third World has now gotten the message. The industrialized nations of the world produce about 70% of the carbon dioxide that goes into the air each year. Third world countries are now seeing this as hogging all the CO2 space in the air. Since the wealthy nations are belching out most of the CO2 they must also be responsible for most of the dangerous global warming. So what to do? Well the answer in the Third World appears to be “hey man you owe me”. The rich countries are causing the climate to heat up and that’s going to make a lot of trouble for poor and developing nations. Rising sea levels will flood poor coastal cities. Increased frequency of drought will cause starvation in developing countries. Diseases will spread like wildfire across poor nations. All this because of global warming caused by greedy carbon sucking rich countries. Since the Western world has hogged all the CO2 for decades there’s none left for the poor countries to use. If poor countries were to burn fossil fuels it would just make the problem worse right? Can’t do that! so in order for the developing countries to “develop” they need an alternative way to fund their growth. They can’t grow an economy based on fossil fuels because of global warming. It’s the developed worlds fault that there’s no more room in the atmosphere for any more CO2. The message to the West is pay up man you owe us for all the trouble your causing.
This brings me back to our climate savior, Al Gore. His message has been that burning fossil fuels is bad and we need to turn to cleaner ways of making energy. It’s interesting that he’s deeply invested in many companies that will make billions if not trillions if all this clean energy technology becomes mandatory. And a new climate treaty from Copenhagen will help make that happen if it’s signed and ratified by the United States. Our president is actually going to Copenhagen. If you actually read the proposed treaty it says that we (the United States) will be required to transfer billions and billions of dollars and technology to the Third World. What’s follows is language from the proposed climate treaty that will be drafted in Copenhagen in December.
In order to fulfill this shared vision, Parties have agreed to establish a coherent, cohesive and integrated system of financial and technology transfer mechanisms under the Convention and a follow up/compliance mechanism. These institutions are robust and effective.
Peace prize winner Al Gore’s message has really hit home in the developing countries. They see this transfer of money and technology as “climate debt” owed to them from us for screwing up the climate. It’s reparations for our sins and since we gobbled up all the space in the air with our carbon burning ways we owe them. It’s in the proposed treaty, read it.
So instead of bringing the world together as a peace maker and helping solve it’s problems Gore is helping to split the nations of the world apart. By selling fear of global warming he is inciting anger and rage in the poor nations against the West. By scaring people about the dangers of burning fossil fuels he is driving a carbon tipped wedge between poor countries and wealthy ones. This is not the way of a peace maker. This is the way of an opportunist who will benefit greatly from new carbon financial instruments that have come about with his help. The volume of trading in carbon products exploded after his movie hit the theaters and continues to grow today. Some estimates are that carbon trading may be the biggest thing to happen on Wall Street ever.
One must ask what happens if the industrialized nations don’t go along with Copenhagen’s climate reparations? Will that deepen the rift between the rich and the poor? more than likely. Will this inspire more frustrated young people to hate the West and find terrorism as way to vent that frustration? It’s entirely possible. Could there be forms of climate blackmail to follow? It could make an already dangerous world even more so. And we have our climate savior Al Gore to thank. Remember the need to save the world is always a front for the urge to rule it. This developing conflict for the carbon turf in the air may become known as the Gore war. See pdf here.
“Beware of Prophets seeking Profits.”
See also this post by Joe Bastardi on notes and asides about Climategate here.
See the 12 C’s of Climate Alarmism by Paul Chesser here.
You may be inspired by Lord Lawson’s latest initiative here.
The Day Global Warming Stood StillInvestors Business Daily Editorial
Climate Change: As scientists confirm the earth has not warmed at all in the past decade, others wonder how this could be and what it means for Copenhagen. Maybe Al Gore can Photoshop something before December.
It will be a very cold winter of discontent for the warm-mongers. The climate show-and-tell in Copenhagen next month will be nothing more than a meaningless carbon-emitting jaunt, unable to decide just whom to blame or how to divvy up the profitable spoils of climate change hysteria.
The collapse of the talks coupled with the decision by Senate Majority Leader Harry Reid to put off the Kerry-Boxer cap-and-trade bill, the Senate’s version of Waxman-Markey, until the spring thaw has led Oklahoma Sen. James Inhofe, the leading Republican on the Environment and Public Works Committee, to declare victory over Sen. Barbara Boxer, D-Calif., and the triumph of observable fact over junk science.
“I proudly declare 2009 as the ‘Year of the Skeptic,’ the year in which scientists who question the so-called global warming consensus are being heard,” Inhofe said to Boxer in a Senate speech. “Until this year, any scientist, reporter or politician who dared raise even the slightest suspicion about the science behind global warming was dismissed and repeatedly mocked.”
Inhofe added: “Today I have been vindicated.”
The Ada (Oklahoma) Evening News quotes Inhofe: “So when Barbara Boxer, John Kerry and all the left get up there and say, ‘Yes. We’re going to pass a global warming bill,’ I will be able to stand up and say, ‘No, it’s over. Get a life. You lost. I won,’” Inhofe said.
Now we have the German publication Der Spiegel, which is rapidly becoming the house organ for climate hysteria, weighing in again with the sad news that the earth does not have a fever so we really don’t have to throw out the baby with the rising bath water.
In an article titled, “Climatologists Baffled By Global Warming Time-Out,” author Gerald Traufetter leads off with the observation: “Climatologists are baffled as to why average global temperatures have stopped rising over the last 10 years.” They better figure it out, Der Spiegel warns, because “billions of euros are at stake in the negotiations.”
We are told in sad tones that “not much is happening with global warming at the moment” and that “it even looks as though global warming could come to a standstill this year.” But how can it be that the earth isn’t following all those computer models? Is the earth goddess Gaia herself a climate change “denier”?
The article gloomily notes that a few weeks ago Britain’s Hadley Centre for Climate Prediction and Research pointed out that the earth had in fact only warmed 0.07 degree Celsius from 1999 to 2008 and not by the 0.2 degree Celsius predicted by the U.N.’s Intergovernmental Panel on Climate Change.
An even more inconvenient truth, according to the British experts, is that when their figures are adjusted for two naturally occurring climate phenomena, El Nino and La Nina, the resulting temperature trend is reduced to 0.0 degree Celsius. No, that’s not a typo.
As if that weren’t enough, it seems hackers broke into the computer network run by the Hadley Climate Research Unit, removing 61 megabytes of e-mails and data.
While we don’t condone theft, the hacked data and e-mails have spilled onto the Web and reveal something startling: The scientists at Hadley, one of the world’s leading climate change study centers, aren’t scientifically objective at all.
Indeed, in e-mails, they boast of twisting scientific data to suit their views and to “hide” the truth. At one point, a scientist actually gloats over the death of global warming skeptic John L. Daly, saying, “In an odd way, this is cheering news.”
If true, this is massive scientific fraud.
To add to the warm-mongers’ woes, patron saint Al Gore, the man who claimed to have invented the Internet, might also have claimed the discovery of Photoshop. Dr. Roy Spencer, of the University of Alabama at Huntsville, formerly with NASA, has taken a look at the pictures used to illustrate Gore’s new book, “Our Choice: A Plan To Solve the Climate Crisis.”
Gore Photoshopped NASA imagery of the earth for the fold-out cover photo, adding four hurricanes at once, including one spinning in the wrong direction next to Florida and, in a physical impossibility, one on the equator next to Peru. Somewhere in the process, the island of Cuba was deleted.
It is the warm-mongers who are spinning in the wrong direction. We win. You lose. Get a life. See editorial here.
Vancouver Sun
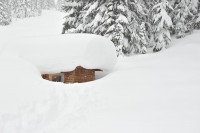
“Whistler Blackcomb ski resort has reported 98” the last seven days and 165” November. This makes it the snowiest November on Record at Whistler Blackcomb.
See larger image here. H/T Tim Kelley.
“I’ve skied here for over 15 years and I’ve never seen this much snow so early in a season, it seems like every day’s snowfall is topping the last,” said Stephen Butt, communications coordinator and voice of the Snow Phone for Whistler Blackcomb . “We have already received one third of our average annual snowfall for the entire season and it’s only four days into the season, it’s unbelievable!”
See photo gallery here.
This record Whistler Blackcomb ski resort November snowfall is occurring in spite of the National Weather Service predictions in No Need to go to the Desert for the Winter, in the October 1 Tacoma News Tribune link, that begins as follows,
“Skiers may want to hold off on buying that new set of snow skis for the coming winter. Umbrellas still will come in handy but there may not be enough rain to seriously challenge river levees. El Nino is back and that usually means a mild Northwest winter with less rain and higher temperatures than normal, one of the National Weather Services top climatologists said Wednesday.”
See more here.
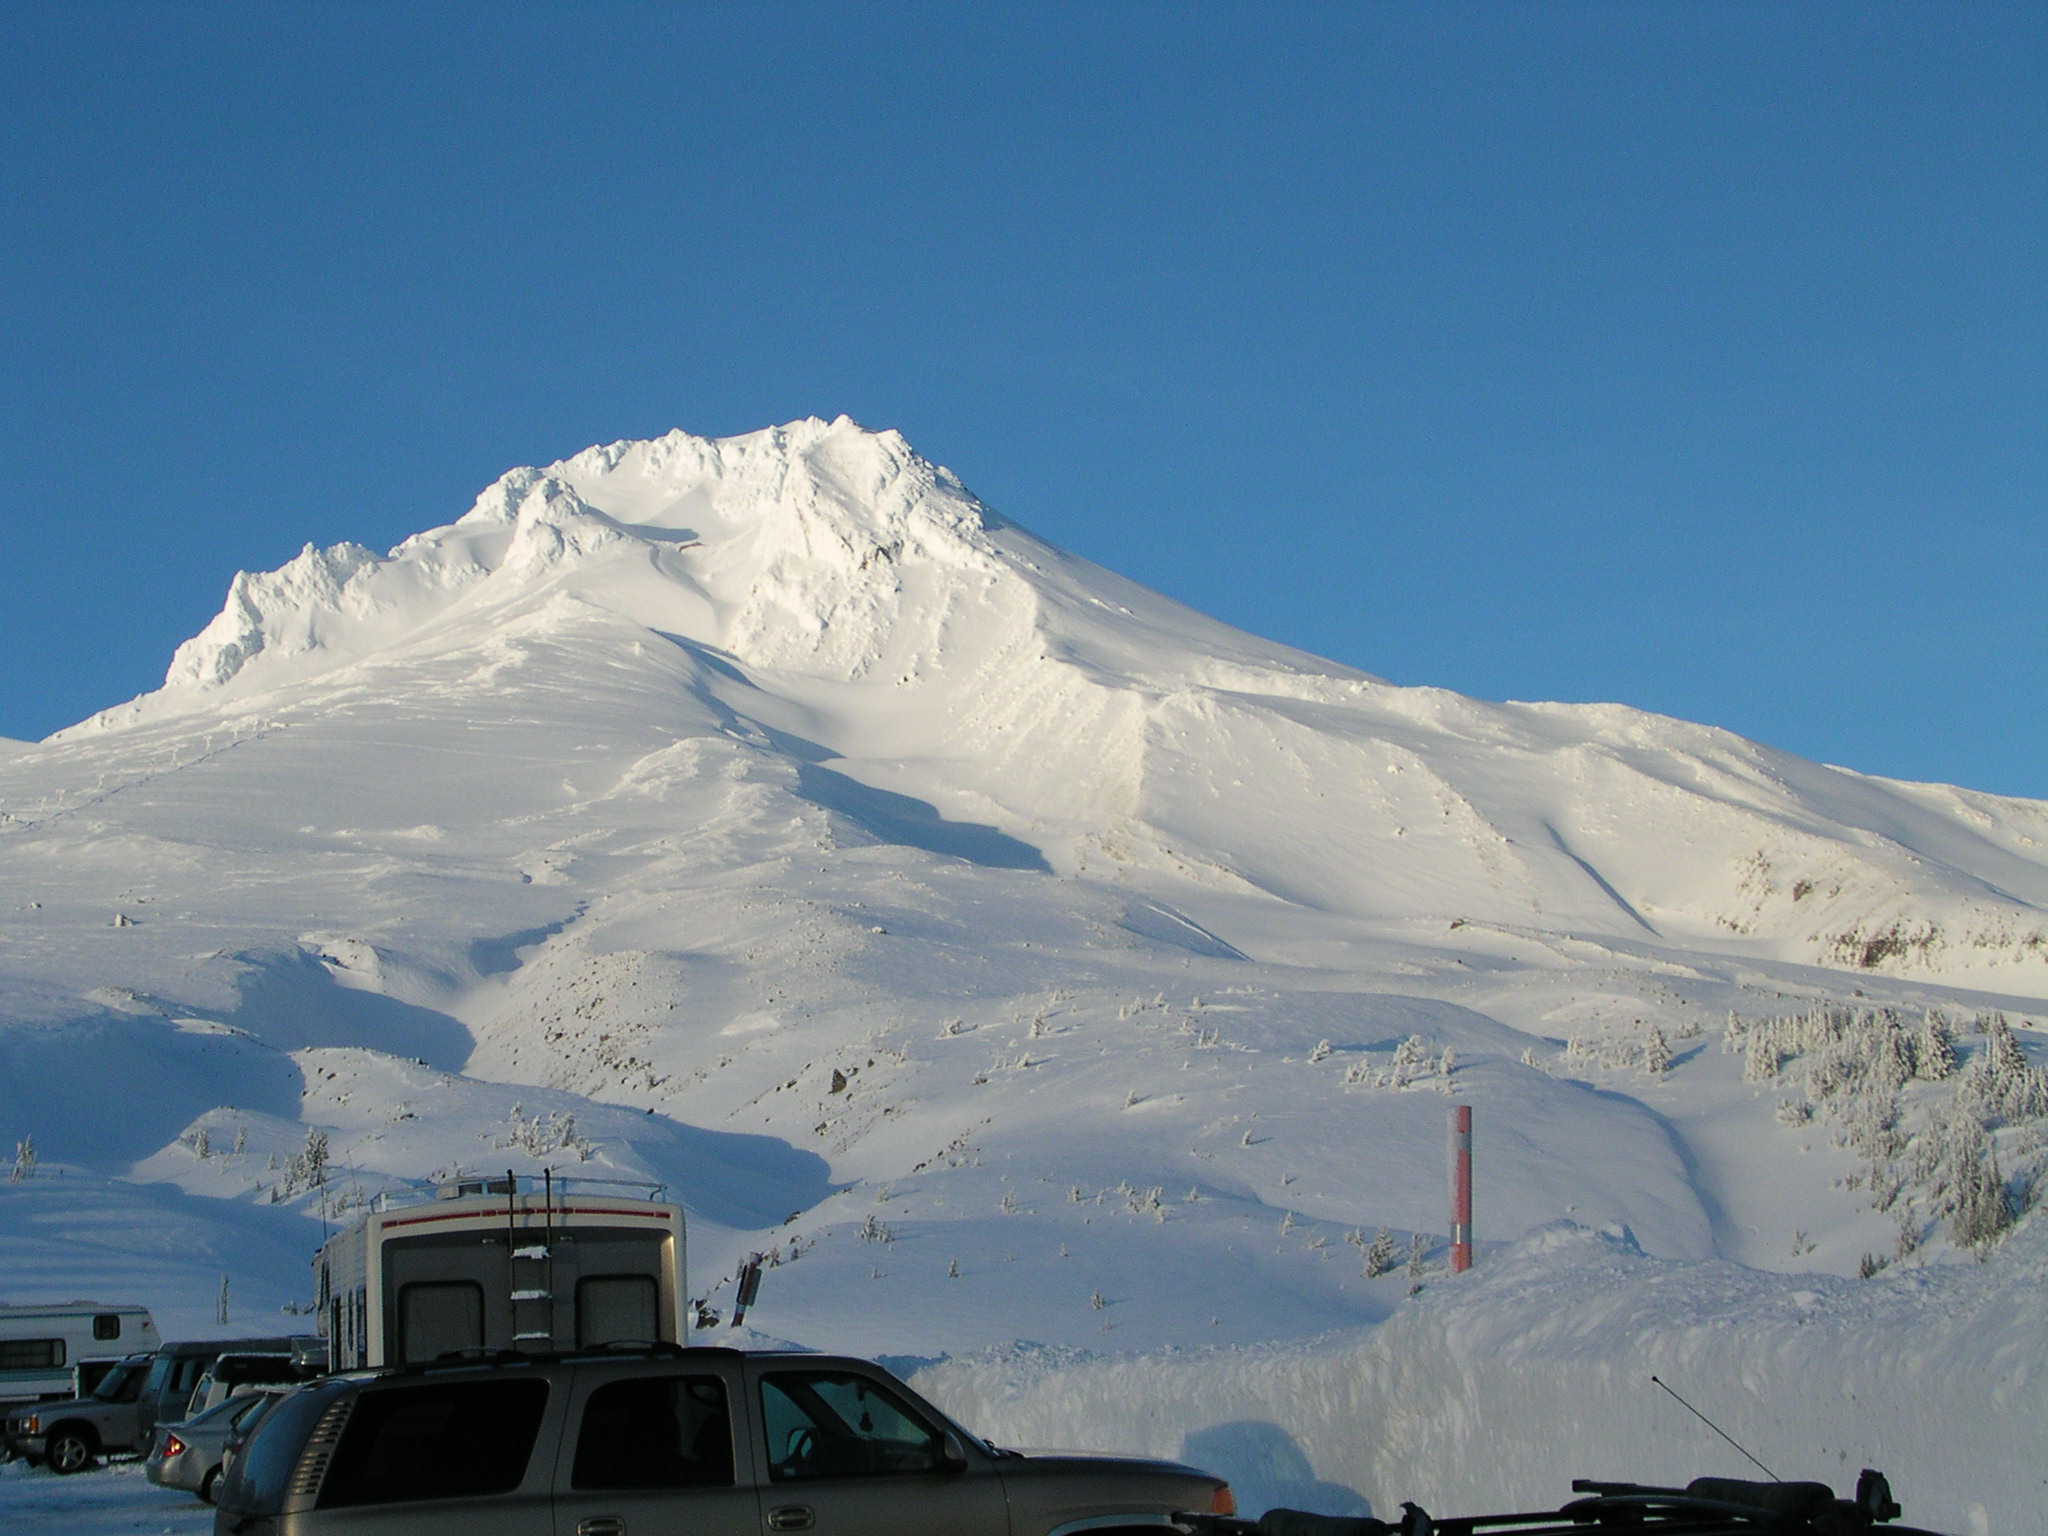
Additional information courtesy of Ken Schlichte: “Looks like record snow coming to Mt Hood too. Timberline already has a 50 inch base and 98 inch snow fall to date with much more snow forecast for the rest of November. See links here and here.
Last winter during the snow in town we drove from Tualatin to Timberline, and back, and never drove on pavement.

See larger image here.
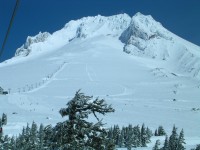
See larger image here.
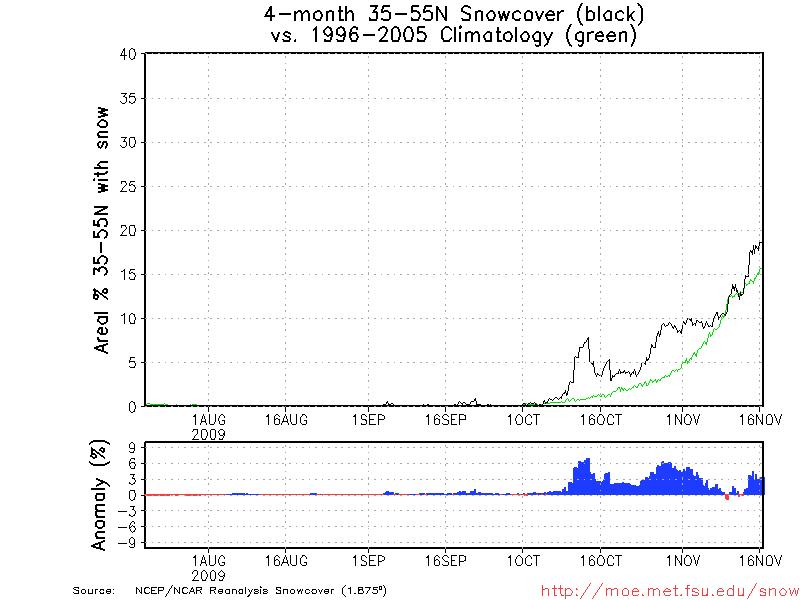
See FSU snowcover. Note the greater than normal extent in Asia, less in southern Canada north central US. This will change late this month.
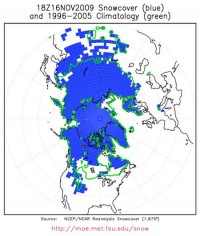
See larger image here.
Still notice the above normal snowpack in mid latitudes (35-55 N).
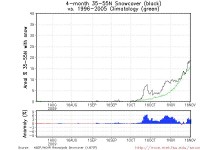
See larger image here.
---------------------------------
BEIJING - See these stories on the killer cold and snow in China here and here. Unusually early snow storms in north-central China have claimed 40 lives, caused thousands of buildings to collapse and destroyed almost 500,000 acres (200,000 hectares) of winter crops, the Civil Affairs Ministry said Friday. Nineteen of the deaths resulted from traffic accidents related to the storms that began Nov. 9, the ministry said in a statement on its Web site. The snowfall is the heaviest in the northern and central provinces of Hebei, Shanxi, Shaanxi, Shandong and Henan since record keeping began after the establishment of the Communist state in 1949, the ministry said without giving detailed figures. It estimated economic losses from the storm at 4.5 billion yuan (US$659 million).
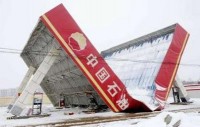
Chinese state media say some of the snow was induced through cloud seeding, although the precise amount of snowfall in all areas was not reported and it wasn’t clear what the previous records were. Hebei’s provincial capital, Shijiazhuang, received the heaviest snowfall - 3.7 inches (9.4 centimeters) - on Nov. 10, the day of the heaviest flurries.

More than 7.5 million people have been stranded or otherwise affected by the storms, which caused the collapse of more than 9,000 buildings, damaged 470,000 acres (190,000 hectares) of crops, and forced the evacuation of 158,000 people, the ministry said. State media have reported at least two deaths were caused by the collapse of buildings, including a school cafeteria. Beijing has been hit by three successive waves of snow, causing havoc on roadways and forcing the cancellation or delay of scores of flights.
The capital and surrounding areas are little prepared to deal with such heavy snow, with few plows or road deicing supplies. Snow tires and chains are almost unknown and many drivers simply leave their cars at home and turn to public transport in such conditions. The impact has been far greater in the surrounding provinces of Hebei, Shanxi, Shaanxi, Shandong and Henan, where highways have been closed, schools shuttered, and crews sent to rescue people in their snowbound homes.
Freak snow and ice storms last year hit parts of eastern and southern China unaccustomed to such weather. Those storms paralyzed key transport systems just as millions of migrant workers were heading home for the Lunar New Year holiday, leading to more than 80 deaths and billions of dollars in damage.
By Christopher Monckton
Why is true debate about the science behind “global warming” and the extent (if any) of the manmade threat to the planet so very rare? Late in 2006, the Institute for Public Policy Research, a Socialist think-tank in the UK, proposed that the Left should in future merely assert that there was no scientific dissent, the debate was over, and the Earth doomed - unless, of course, the economies of the free West were shut down as completely and as rapidly as possible.
Of all the elaborate lies that feed the climate scare, this was the most successful. Ever since it was first circulated, Leftist academics, scientists, politicians, bureaucrats, and journalists worldwide were relieved that they no longer had to argue against the mounting body of scientific evidence and data pointing to the fact that the influence of greenhouse gases on temperature is far smaller than the UN’s climate panel admits. They simply refused to debate the issue.
However, on rare occasions one of the true-believers in the New Religion is so appalled when the scientific truth is unexpectedly published that he becomes drawn into - horror of horrors - a real debate about the credibility of the science behind the scare.
In the April/May 2009 Journal of the Chartered Insurance Institute of London, Paul Maynard and I published an article entitled Let Cool Heads Prevail, expressing grave scientific doubt about the supposed magnitude of the anthropogenic effect on global temperature, and providing substantial evidence from the published data and from the peer-reviewed literature. Our article caught the insurance industry by surprise. Lloyds of London had publicly issued blood-curdling warnings of the climatic terrors allegedly to come. The Prince of Wales had established Climate Wise, a group of leading figures in the insurance market committed, in effect, to peddling and promulgating the scare, and to silencing all dissent. The market was sewn up. How, then, could no less an organ of academic opinion than the Journal have allowed two heretics - one of them a very senior and widely-respected figure in the insurance world - to publish a substantial and well-referenced paper demonstrating that the scare was scientifically baseless?
The first instinct of the true-believers was to try to prevent our paper from being published. However, the last vestiges of belief in free speech prevented an outright ban. Instead, a clumsy attempt was made to censor the paper, reducing its length substantially and cutting out its central scientific argument to the effect that the UN’s climate panel had prodigiously exaggerated the actually-minuscule effect of changes in atmospheric greenhouse-gas concentrations on global mean surface temperature.
My co-author, Paul Maynard, and I decided not to accept censorship. We made it clear that if our paper were not published in full, at the agreed length, we should arrange for publication elsewhere, with an additional paragraph pointing out that certain parties had wanted to censor the paper when it had been due to appear in the Journal.
Free speech prevailed. Our paper was published in full. This is what happened next:
- The leading firm of insurance brokers where Paul Maynard works was contacted and was pointedly asked whether it still adhered to the Climate Wise principles. The firm replied, splendidly, that it was also committed to free speech and to serious academic debate about the extent of the imagined threat to the climate.
- The Journal received, and printed in its next edition, a letter from the Chairman of Climate Wise comparing my co-author and me to flat-earthers who believed that the Earth was a disk carried on the back of a giant tortoise. The letter did not make any attempt to rebut even one of the scientific data or arguments we had presented.
- The Journal received, but did not print in its next edition, a very large number of letters supporting our paper’s conclusions.
- When we protested that the overwhelming majority of the letters in response to our paper had been supportive, but that all of these letters had been suppressed, the Journal printed a single letter congratulating the Journal for publishing our paper and condemning the chairman of Climate Wise for insulting the readers’ intelligence by treating us as flat-earth freaks: “Instead of rebutting the claims made by the authors, Maynard and Monckton, he makes childish references to flat plates and a giant tortoise. If this is the level of response to a very detailed and expertly-argued counter to the widely-held view that the release of carbon by human activity is causing global warming, what value should we place on Climate Wise?”
- The Journal also received a long letter from Dr. Andrew Dlugolecki, a contributor to the UN’s climate reports, strongly criticizing the science in our paper and attaching a 10-page commentary which - mirabile dictu - actually debated what we had written.
- We produced a 40-page response to Dr. Dlugolecki’s letter and commentary, answering each of his points in turn and in detail. We suggested that the Journal should print his letter and a letter of reply from us, with a weblink to his commentary and to our detailed response.
- The Journal at first told us it would print Dr. Dlugolecki’s letter, with a weblink to his commentary, but would not print any letter from us, and would not provide a weblink to our response to his commentary.
- I pointed out that Dr. Dlugolecki’s letter and commentary were libelous if unanswered by us, in that he had falsely accused us of having deliberately misrepresented the science.
- The Journal told us it would print neither Dr. Dlugolecki’s material nor ours.
In the interest of fairness and open debate, therefore, the Science and Public Policy Institute has agreed to publish our original Journal article, Dr. Dlugolecki’s letter, our draft letter of reply, his commentary on our article, and our detailed response to that commentary.
I hope that readers will find this document fascinating. Precisely because supporters of the climate scare nearly always refuse to debate the issue, this is one of the very rare instances where the arguments for and against the apocalyptic view of “global warming” appear side by side. Readers may like to ask themselves the following questions as they read it -
1. Which side of the debate has best argued ad rem rather than ad hominem ad rem - discussing the subject at hand rather than merely inveighing against the opponent?
2. Which side has best avoided the temptation to set up straw men, stating and then attacking a point of view that the opponent has not in fact expressed?
3. Which side has been best able to produce reasoned, detailed, quantitative arguments in support of its position?
Get a comfortable seat and your favorite beverage and read this long but fascinating journey through the classic battle between data based reason and dogma here.
By Christopher Monckton
Why is true debate about the science behind “global warming” and the extent (if any) of the manmade threat to the planet so very rare? Late in 2006, the Institute for Public Policy Research, a Socialist think-tank in the UK, proposed that the Left should in future merely assert that there was no scientific dissent, the debate was over, and the Earth doomed - unless, of course, the economies of the free West were shut down as completely and as rapidly as possible.
Of all the elaborate lies that feed the climate scare, this was the most successful. Ever since it was first circulated, Leftist academics, scientists, politicians, bureaucrats, and journalists worldwide were relieved that they no longer had to argue against the mounting body of scientific evidence and data pointing to the fact that the influence of greenhouse gases on temperature is far smaller than the UNs climate panel admits. They simply refused to debate the issue.
However, on rare occasions one of the true-believers in the New Religion is so appalled when the scientific truth is unexpectedly published that he becomes drawn into - horror of horrors - a real debate about the credibility of the science behind the scare.
In the April/May 2009 Journal of the Chartered Insurance Institute of London, Paul Maynard and I published an article entitled Let Cool Heads Prevail, expressing grave scientific doubt about the supposed magnitude of the anthropogenic effect on global temperature, and providing substantial evidence from the published data and from the peer-reviewed literature. Our article caught the insurance industry by surprise. Lloyds of London had publicly issued blood-curdling warnings of the climatic terrors allegedly to come. The Prince of Wales had established Climate Wise, a group of leading figures in the insurance market committed, in effect, to peddling and promulgating the scare, and to silencing all dissent. The market was sewn up. How, then, could no less an organ of academic opinion than the Journal have allowed two heretics one of them a very senior and widely-respected figure in the insurance world - to publish a substantial and well-referenced paper demonstrating that the scare was scientifically baseless?
The first instinct of the true-believers was to try to prevent our paper from being published. However, the last vestiges of belief in free speech prevented an outright ban. Instead, a clumsy attempt was made to censor the paper, reducing its length substantially and cutting out its central scientific argument to the effect that the UN’s climate panel had prodigiously exaggerated the actually-minuscule effect of changes in atmospheric greenhouse-gas concentrations on global mean surface temperature.
My co-author, Paul Maynard, and I decided not to accept censorship. We made it clear that if our paper were not published in full, at the agreed length, we should arrange for publication elsewhere, with an additional paragraph pointing out that certain parties had wanted to censor the paper when it had been due to appear in the Journal.
Free speech prevailed. Our paper was published in full. This is what happened next:
- The leading firm of insurance brokers where Paul Maynard works was contacted and was pointedly asked whether it still adhered to the Climate Wise principles. The firm replied, splendidly, that it was also committed to free speech and to serious academic debate about the extent of the imagined threat to the climate.
- The Journal received, and printed in its next edition, a letter from the Chairman of Climate Wise comparing my co-author and me to flat-earthers who believed that the Earth was a disk carried on the back of a giant tortoise. The letter did not make any attempt to rebut even one of the scientific data or arguments we had presented.
- The Journal received, but did not print in its next edition, a very large number of letters supporting our papers conclusions.
- When we protested that the overwhelming majority of the letters in response to our paper had been supportive, but that all of these letters had been suppressed, the Journal printed a single letter congratulating the Journal for publishing our paper and condemning the chairman of Climate Wise for insulting the readers’ intelligence by treating us as flat-earth freaks: “Instead of rebutting the claims made by the authors, Maynard and Monckton, he makes childish references to flat plates and a giant tortoise. If this is the level of response to a very detailed and expertly-argued counter to the widely-held view that the release of carbon by human activity is causing global warming, what value should we place on Climate Wise?”
- The Journal also received a long letter from Dr. Andrew Dlugolecki, a contributor to the UN’s climate reports, strongly criticizing the science in our paper and attaching a 10-page commentary which - mirabile dictu - actually debated what we had written.
- We produced a 40-page response to Dr. Dlugolecki’s letter and commentary, answering each of his points in turn and in detail. We suggested that the Journal should print his letter and a letter of reply from us, with a weblink to his commentary and to our detailed response.
- The Journal at first told us it would print Dr. Dlugolecki’s letter, with a weblink to his commentary, but would not print any letter from us, and would not provide a weblink to our response to his commentary.
- I pointed out that Dr. Dlugolecki’s letter and commentary were libelous if unanswered by us, in that he had falsely accused us of having deliberately misrepresented the science.
- The Journal told us it would print neither Dr. Dlugolecki’s material nor ours.
In the interest of fairness and open debate, therefore, the Science and Public Policy Institute has agreed to publish our original Journal article, Dr. Dlugolecki’s letter, our draft letter of reply, his commentary on our article, and our detailed response to that commentary.
I hope that readers will find this document fascinating. Precisely because supporters of the climate scare nearly always refuse to debate the issue, this is one of the very rare instances where the arguments for and against the apocalyptic view of global warming appear side by side. Readers may like to ask themselves the following questions as they read it -
1. Which side of the debate has best argued ad rem rather than ad hominem ad rem - discussing the subject at hand rather than merely inveighing against the opponent?
2. Which side has best avoided the temptation to set up straw men, stating and then attacking a point of view that the opponent has not in fact expressed?
3. Which side has been best able to produce reasoned, detailed, quantitative arguments in support of its position?
Get a comfortable seat and your favorite beverage and read this long but fascinating journey through the classic battle between data based reason and dogma here.
By Joseph D’Aleo, November 14, 2009
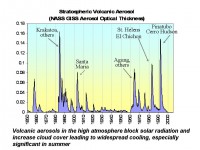
In a recent UK Telegraph piece, Dr. Ian Plimer, author of the best seller Heaven and Earth argues CO2 is not causing global warming. The Telegraph title is correct but not one of the central themes of the story - that volcanoes are the primary source of CO2 increases. They were in the early days of the planet one of the key sources of all gases, but now other natural and anthropogenic sources dominate. Ian Plimer informs us that is what he told the reporter but the reporter got the facts incorrect.
The Pinatubo eruption was estimated to have emitted only a modest 42 megatons CO2 (Gerlach 1996), a small fraction of the total natural and anthropogenic annual emissions. Major volcanism causes global CO2 level rise to actually decrease significantly for a year following. This can be seen after Agung in 1964, after El Chichon in 1982 and Pinatubo in 1992.
Alan Robock in “Introduction: Mount Pinatubo as a Test of Climate Feedback Mechanisms” (2003) showed a decrease in CO2 rate after Pinatubo, El Chichon and Agung.
He noted “enhanced vegetation growth from more diffuse and less direct solar radiation took more carbon dioxide out of the atmosphere than normal, temporarily reducing the observed long-term increase in carbon dioxide.”
Angert et.a; (2004) looked at whether the “Enhanced CO2 Sink Following the Mt. Pinatubo Eruption Driven by an Increase in Diffuse Radiation?” They noted in their abstract that “following the Mt. Pinatubo eruption in 1991, there was a sharp decrease in the atmospheric CO2 growth rate. It is believed that this decrease was caused by an anomalous strong terrestrial sink in the northern hemisphere. This strong sink is hard to explain, since the global low temperatures that followed the eruption (as a result of the injecting of volcanic aerosols to the stratosphere) were expected to reduce photosynthesis rate. There are currently two competing explanations for the enhanced sink. The first is that soil respiration rate declined more than photosynthesis rate, while the second suggests that the increase in the fraction of diffused radiation, as a result of the aerosol loading, caused an increase in photosynthesis.”
In their study they found that “the enhanced sink cannot be explained by decreased respiration alone, and thus can be only explained by several land and ocean sink mechanisms acting in concert.”
THE OCEANS ROLE
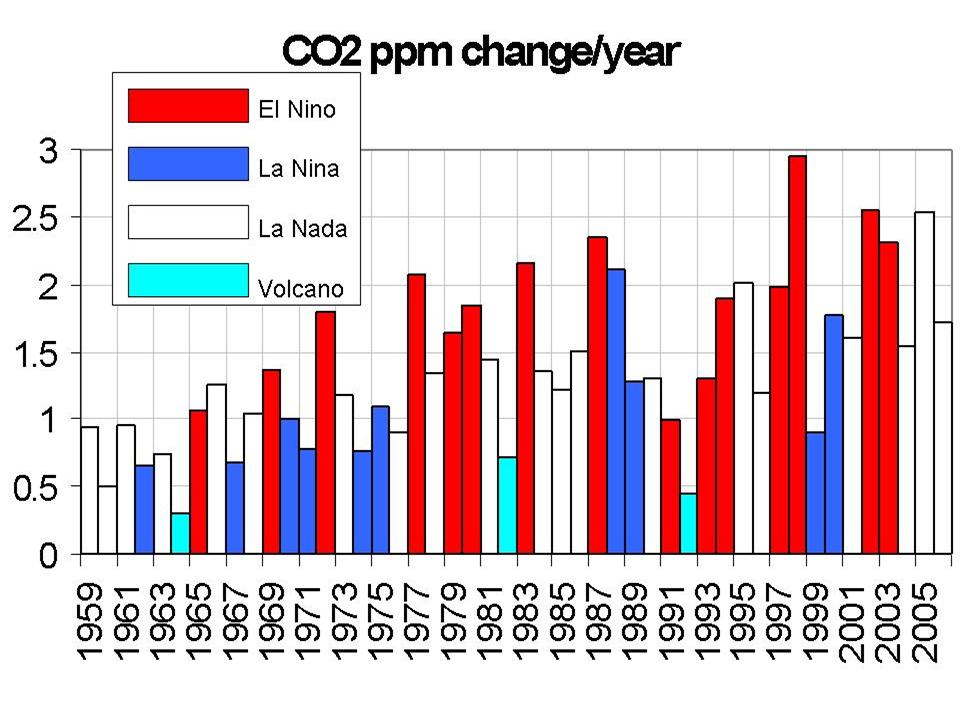
By going further and separating the years by El Nino state and volcanism, we see the importance of the tropical ocean in the CO2 increases. The primary source in the oceans comes from the tropical waters while the cold high latitude waters are sinks for CO2. This is the well known fizz effect from carbonated beverage. When you open a cold beverage it has a lot of fizz (pumped in CO2), let out to sit and warm on the counter and the gas escapes, eventually leaving the beverage flat. Whether a water body is a net absorber or emitter of CO2 is deternmined by Henry’s Law. Equilibrium is established between air and water or the atmosphere and ocean rapidly when CO2 levels change or when water and or air temperatures vary. We see that in both annual and interannual changes.
See large image here.
On average the greatest increases occur in El Nino years, when the tropical oceans are warmest (averaging 1.80ppm/year or 0.54%), much lower rates in La Ninas (1.05ppm/year or 0.31%) and very low rates of increase (0.61ppm or 0.14%) in years of the three major volcanoes. This suggests the major role tropical OCEANS play in CO2 production.
It also suggests that long term changes in the ocean temperatures (the warming since the last little ice age) may be responsible for much of the increase in CO2 observed just as it has in the past. Man after all is directly responsible for only 3-4% of the annual CO2 production (and given the 0.038% trace gas content for CO2, man’s annual contribution represents just 0.0001% of the atmosphere).
And importantly the lifetime of CO2 in the atmosphere contrary to Robock and the IPCC has been definitively shown to be the order of 5 to 6 years (Segalstad 1998) not 100-200 years or as Solomon has speculated 1000 years.
Segalstad (1992; 1993; 1996) further concluded from 13-C/12-C isotope mass balance calculations, in accordance with the 14-C data, that at least 96% of the current atmospheric CO2 is isotopically indistinguishable from non-fossil-fuel sources, i.e. natural marine and juvenile sources from the Earth’s interior. Hence, for the atmospheric CO2 budget, marine equilibration and degassing, and juvenile degassing from e.g. volcanic sources, must be much more important; and the sum of burning of fossil-fuel and biogenic releases (4%) much less important, than assumed (21% of atmospheric CO2) by the authors of the IPCC model (Houghton et al., 1990).
See larger image here.
Read much more about CO2 versus temperatures and how volcano aerosols are an important factor in climate changes on the short term (2 to 4 years) and when they cluster on longer time frames (most of the 1960s) here.
BEIJING - See these stories on the killer cold and snow in China here and here. Unusually early snow storms in north-central China have claimed 40 lives, caused thousands of buildings to collapse and destroyed almost 500,000 acres (200,000 hectares) of winter crops, the Civil Affairs Ministry said Friday. Nineteen of the deaths resulted from traffic accidents related to the storms that began Nov. 9, the ministry said in a statement on its Web site. The snowfall is the heaviest in the northern and central provinces of Hebei, Shanxi, Shaanxi, Shandong and Henan since record keeping began after the establishment of the Communist state in 1949, the ministry said without giving detailed figures. It estimated economic losses from the storm at 4.5 billion yuan (US$659 million).
Chinese state media say some of the snow was induced through cloud seeding, although the precise amount of snowfall in all areas was not reported and it wasn’t clear what the previous records were. Hebei’s provincial capital, Shijiazhuang, received the heaviest snowfall - 3.7 inches (9.4 centimeters) - on Nov. 10, the day of the heaviest flurries.
More than 7.5 million people have been stranded or otherwise affected by the storms, which caused the collapse of more than 9,000 buildings, damaged 470,000 acres (190,000 hectares) of crops, and forced the evacuation of 158,000 people, the ministry said. State media have reported at least two deaths were caused by the collapse of buildings, including a school cafeteria. Beijing has been hit by three successive waves of snow, causing havoc on roadways and forcing the cancellation or delay of scores of flights.
The capital and surrounding areas are little prepared to deal with such heavy snow, with few plows or road deicing supplies. Snow tires and chains are almost unknown and many drivers simply leave their cars at home and turn to public transport in such conditions. The impact has been far greater in the surrounding provinces of Hebei, Shanxi, Shaanxi, Shandong and Henan, where highways have been closed, schools shuttered, and crews sent to rescue people in their snowbound homes.
Freak snow and ice storms last year hit parts of eastern and southern China unaccustomed to such weather. Those storms paralyzed key transport systems just as millions of migrant workers were heading home for the Lunar New Year holiday, leading to more than 80 deaths and billions of dollars in damage.
-----------------------------
Lou Dobbs announced his last broadcast at CNN after 30 years. Lou was unique in the world of the mainstream media in that he presented both sides of the global climate change issue. Here, it was disclosed he had 8 million good reasons.
-------------------------------
Weather Jazz: Episode #021, Meteorologist Andre Bernier. Release Date: November 10, 2009 “What does it take in order to put together a long-range winter forecast for the nation?” Join Andre’s former professor of meteorology, Joe D’Aleo for an engaging look at all the parameters that go into it. See page and download episode here. In part II, they will discuss the Weather Channel early days.
Also last week I had the privilege to participate with Dr. Tim Ball and Robert Felix on a fine new internet chat on climate issues on Its Rain Making Time here.
This week David Legates and Willie Soon were interviewed in Its Rainmaking Time in The Truth About Climate & Weather Part 2: The Plot Thickens
.-----------------------------------
Science is in on climate change sea-level rise: 1.7mm
By Drew Warne-Smith and James Madden, The Australian
Sea levels on Australia’s eastern seaboard are rising at less than a third of the rate that the NSW government is predicting as it overhauls the state’s planning laws and bans thousands of landowners from developing coastal sites.
The Rees government this week warned that coastal waters would rise 40cm on 1990 levels by 2050, with potentially disastrous effects. Even yesterday Kevin Rudd warned in a speech to the Lowy Institute that 700,000 homes and businesses, valued at up to $150 billion, were at risk from the surging tide.

However, if current sea-level rises continue, it would not be until about 2200 - another 191 years - before the east coast experienced the kind of increases that have been flagged. According to the most recent report by the Bureau of Meteorology’s National Tidal Centre, issued in June, there has been an average yearly increase of 1.9mm in the combined net rate of relative sea level at Port Kembla, south of Sydney, since the station was installed in 1991.
This is consistent with historical analysis showing that, throughout the 20th century, there was a modest rise in global sea levels of about 20cm, or 1.7mm per year on average. By comparison, the NSW government’s projections - based on global modelling by the Intergovernmental Panel on Climate Change as well as CSIRO regional analysis - equate to a future rise of about 6.6mm a year. Such a projection has caused widespread concern for landowners and developers, derision from “climate sceptics” within the scientific community and even some head-scratching from Wollongong locals such as Kevin Court, 80.
“I have swum at this beach every day for the past 50 years, and nothing much changes here,” Mr Court said yesterday as he emerged from the surf at Wollongong’s North Beach, just a short paddle from the Port Kembla gauging station. “All this talk about rising sea levels - most of us old-timers haven’t seen any change and we’ve been coming down here for decades.
“A few years ago part of the bank at the back of the beach was eroded. But you look at it now, and all the grass has grown back over it. The water hasn’t washed back there for years. “And that’s nature. It’s up and down, it comes and goes in cycles - nothing dramatic.”
The complex task of tracking sea levels is being performed by the Australian Baseline Sea Level Monitoring Project, which is co-ordinated by the National Tidal Centre. The project operates 16 gauging stations around the country, with the eastern seaboard monitored by stations at Port Kembla, as well as Rosslyn Bay and Cape Ferguson, in Queensland.
Bob Carter, a geologist and environmental scientist with James Cook University in Queensland, said he was “baffled” as to why states and local councils would develop policy based primarily on global averages and not the records of local tidal gauges. In the past year, the Port Kembla gauge has recorded a sea-level rise of just 0.1 mm. “When you design a house in Sydney, do you entrust the architect and builder to do the heating and air-conditioning based on global average temperature? Of course not,” Professor Carter said.
He added that even if seas were rising as much as 3.3mm a year - the CSIRO’s current global estimate - they would remain within the bounds of natural and normal variation. “There have been lots of times in our history when sea levels rose as much or more than now,” Professor Carter said. “There is nothing unusual in the current situation.”
Meteorologist Bill Kininmonth, former head of the National Climate Centre, is another to express concern about the way future sea-level rises have been modelled. Mr Kininmonth believes only a thin layer of the ocean is actually warming - about 200m - making it unlikely the oceans are expanding to any great degree. He said there was little compelling evidence that the polar caps were melting and causing sea levels to rise.
Computer models also tended to underestimate the way evaporation regulated temperature, thereby exaggerating future temperature predictions, Mr Kininmonth added. “There’s little reason to think the little bit of extra heat generated by greenhouse gases will make a dramatic difference,” he said.
However, the consensus view of the scientific community remains that sea-levels are rising at an accelerated rate because of human activity that has warmed Earth. The CSIRO’s John Church, considered one of the world’s leading authorities on sea-level rise, told The Weekend Australian yesterday he remained convinced waters along the eastern seaboard were rising in line with global averages. He noted that the BOM’s gauge results for Port Kembla as published here did not include the effect of barometric pressure, which, if included, would lift the sea-level increase to 3.1mm, not much less than agreed global estimates.
The Australian continent was also rising slightly - about 0.3-0.4mm a year around Sydney - which had partially offset increases in sea levels, he said. And an analysis of records from a gauge at Fort Denison in Sydney Harbour - not incorporated in the National Tidal Centre report - also revealed that, after 1950, periods of extreme sea-level rises occurred three times as frequently as in the first half of that century.
“There is a clear acceleration in the rate of sea-level rise,” Dr Church said. “In the last 20 years, it’s almost twice the global average for the 20th century.” Dr Church said the NSW coast was likely to experience sea-level rises greater than global estimates due to changes in the wind stress patterns in the Pacific Ocean, which will strengthen the East Australian Current. And if polar ice caps were indeed melting at a significant rate - which is not yet established - Australia could witness even bigger swells still.
Dr Church challenged Mr Kininmonth’s assertion that only a thin surface layer of the ocean was warming, saying recent studies provided evidence of deep ocean warming although it couldn’t be quantified as yet. A spokesperson for the NSW Department of Environment, Climate Change and Water said NSW had selected the upper end of the IPCC modelling predictions because both emissions and measured global sea-level rise were now at or above the upper IPCC estimates. See post here.
Icecap Note:
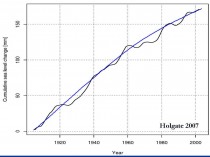
Sea levels globally have slowed (below, enlarged here) in recent decades (Holgate 2007) despite what the ‘leading expert’ Church says:

See sea level rise slow even more after 2006 according to the University of Colorado (enlarged here). To these clowns in the institutions and governments reality is not data but the models.
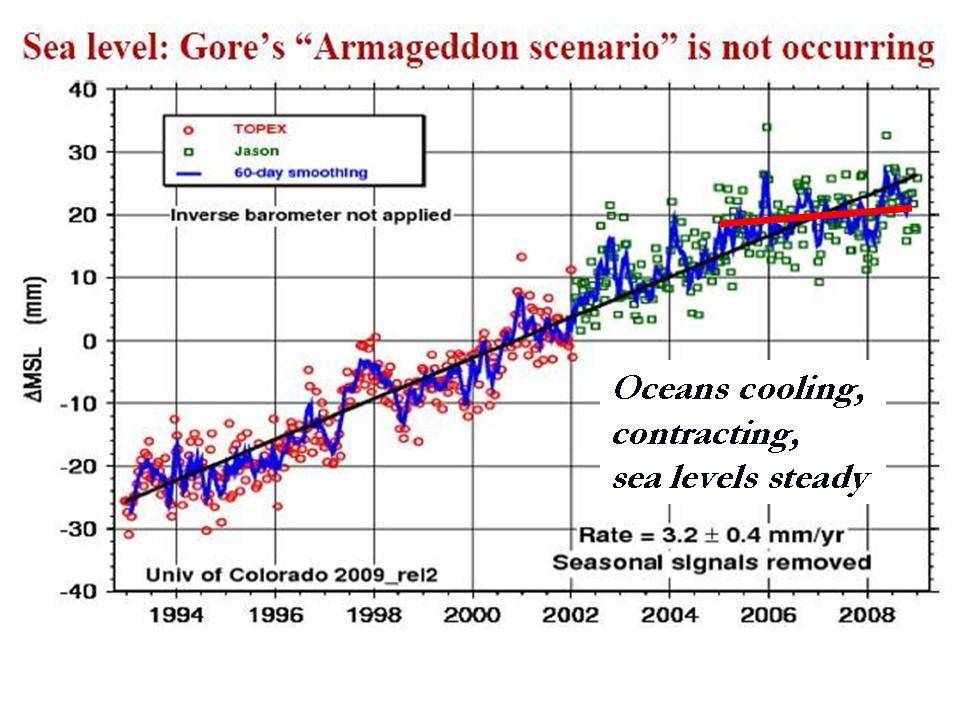
See in this New Zealand Climate Truth Newsletter by Dr. Vincent Gray how the oceans are inconveniently cooling and evidence exists that they are heated from below.
ICECAP UPDATE: See Intellicast story Dalton like Solar Minimum - Back to the Age of Dickens? here.

----------------------
The Sun’s magnetic funk continues
By Anthony Watts, Watts Up With That
I’ve looked at the Ap Index on a regular basis, as it is an indicator of how active the solar dynamo is. When we had sunspot 1029 recently, the largest in months, it gave hope to many that Solar cycle 24 had finally started to ramp up.
From the data provided by NOAA’s Space Weather Prediction Center (SWPC) on November 2nd, you can see that October 2009 had little Ap magnetic activity. The value is now 3 for the month. Here’s my graph from October 2009 SWPC Ap data:
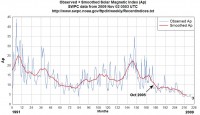
Click here to enlarge.
Leif Svalgaard points out to me another indicator of low solar magnetic activity. Bill Livingston was able to observe sunspot group 1029, and measure its magnetic field and contrast. Leif’s graph with my annotation for group 1029 is below. By itself, this one sunspot group isn’t significant, but it does fit into a prediction made by Livingston and Penn.
See larger here.
The measurement of sunspot group 1029 falls just where there should be on the Livingston and Penn predicted path to invisibility.
WUWT readers may recall this NASA News article in September about L&P’s predictions:
NASA: Are Sunspots Disappearing?
And this article:
Livingston and Penn in EOS: Are Sunspots Different During This Solar Minimum?
And finally this one, which talks about the progression of lower magnetic activity and increased contrast ratios of umbra’s in sunspots:
Livingston and Penn paper: “Sunspots may vanish by 2015”
Since we only have sunspot magnetic and contrast data for about 20 years, one can’t be too certain of the outcome just yet. However, if cycle 24 was indeed ramping up with increased magnetic activity, seeing a spot that was well above the magnetic value of the last couple would certainly be reassuring.
We live in interesting times.
See WUWT story and comments here.
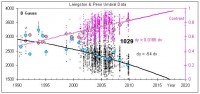
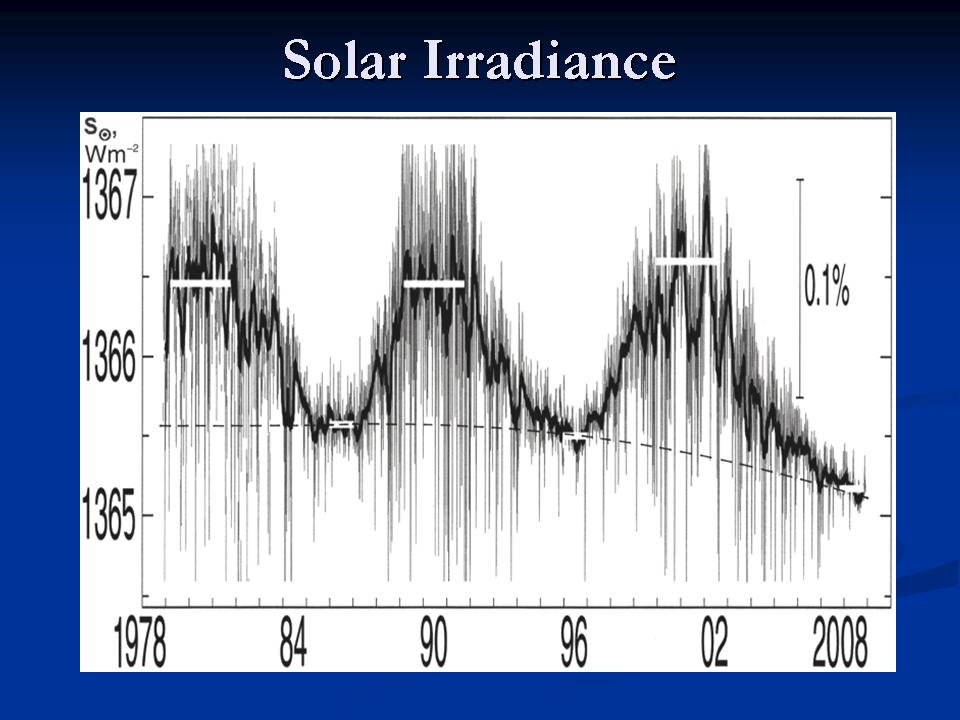
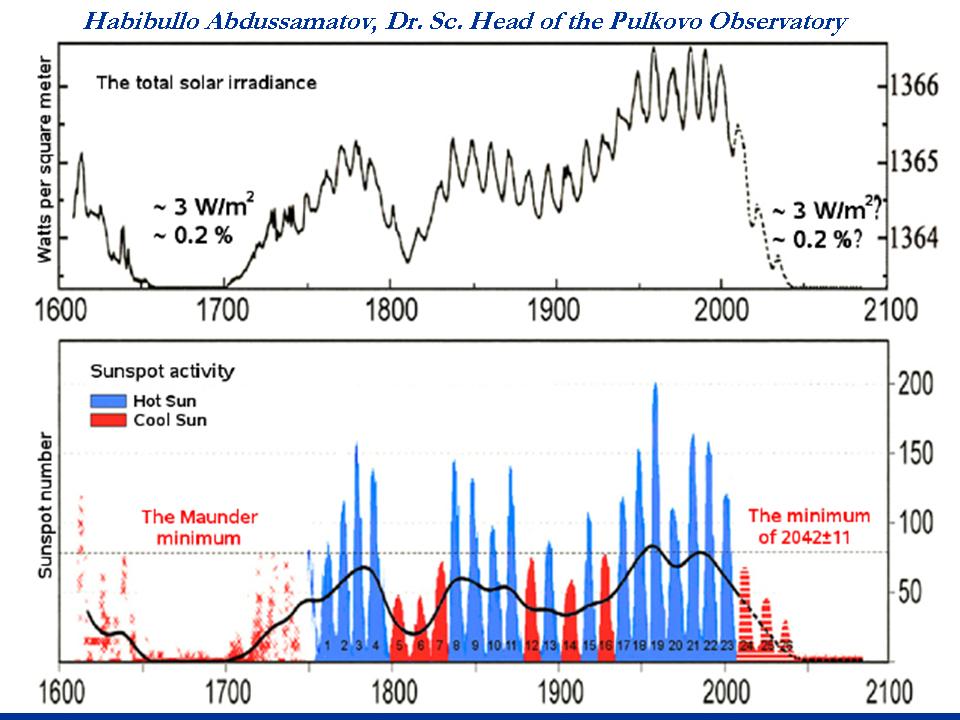
Icecap Note: We recently posted a paper The Sun Defines the Climate by Habibullo Abdussamatov et al of the Russian Pulkovo Observatory who noted the same decline in solar activity - here the solar irradiance this cycle.
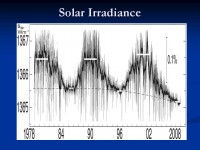
See larger image here.
The authors then makes this prediction about the upcoming century for sunspot numbers. They anticipate temperatures to oscillate for a few more years around current levels and then a significant cooling beginning around 2013 dropping to a deep Maunder like minimum by the middle of the century.
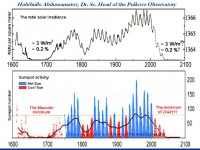
Larger image here.
Download the “Solar Grand Minima Preparedness Guide” here.
AP news story with comments by Joseph D’Aleo and Dr. Richard Keen Updated November 4, 2009
The snows of Kilimanjaro may soon be gone. The African mountain’s white peak made famous by writer Ernest Hemingway is rapidly melting, researchers report.
Some 85 percent of the ice that made up the mountaintop glaciers in 1912 was gone by 2007, researchers led by paleoclimatologist Lonnie Thompson of Ohio State University report in Tuesday’s edition of Proceedings of the National Academy of Sciences.
And more than a quarter of the ice present in 2000 was gone by 2007. If current conditions continue “the ice fields atop Kilimanjaro will not endure,” the researchers said. The Kilimanjaro glaciers are both shrinking, as the ice at their edges melts, and thinning, the researchers found.
Similar changes are being reported at Mount Kenya and the Rwenzori Mountains in Africa and at glaciers in South America (wrong see graph from Masiokas et al. 2006 below and enlarged here for Andes) and the Himalayas (also wrong - see comments on Thompson’s work by Madhav Khandekar here).

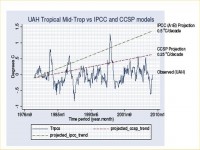
“The fact that so many glaciers throughout the tropics and subtropics are showing similar responses suggests an underlying common cause,” Thompson said in a statement. “The increase of Earth’s near surface temperatures, coupled with even greater increases in the mid- to upper-tropical troposphere, as documented in recent decades, would at least partially explain” the observations. ( Icecap Note: This is not true. Satellites and weather balloons show no warming in mid to high levels in the tropics. Only in the tinkertoy climate models does that happen but to alarmists that is reality. See John Christy plot of tropical temperatures in mid to high atmosphere from satellite below and enlarged here.).
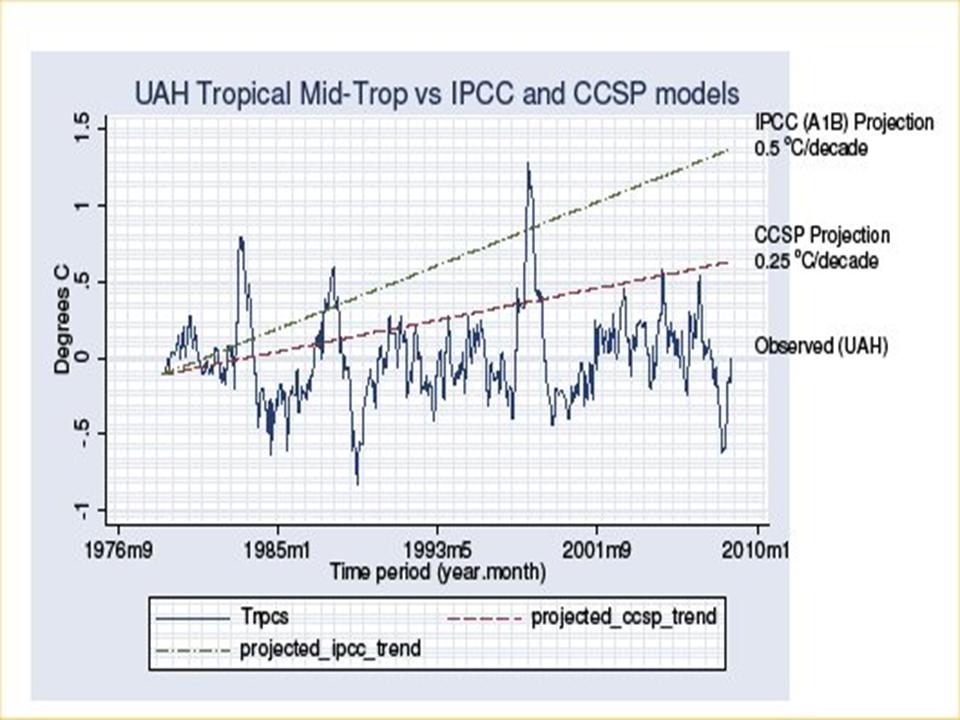
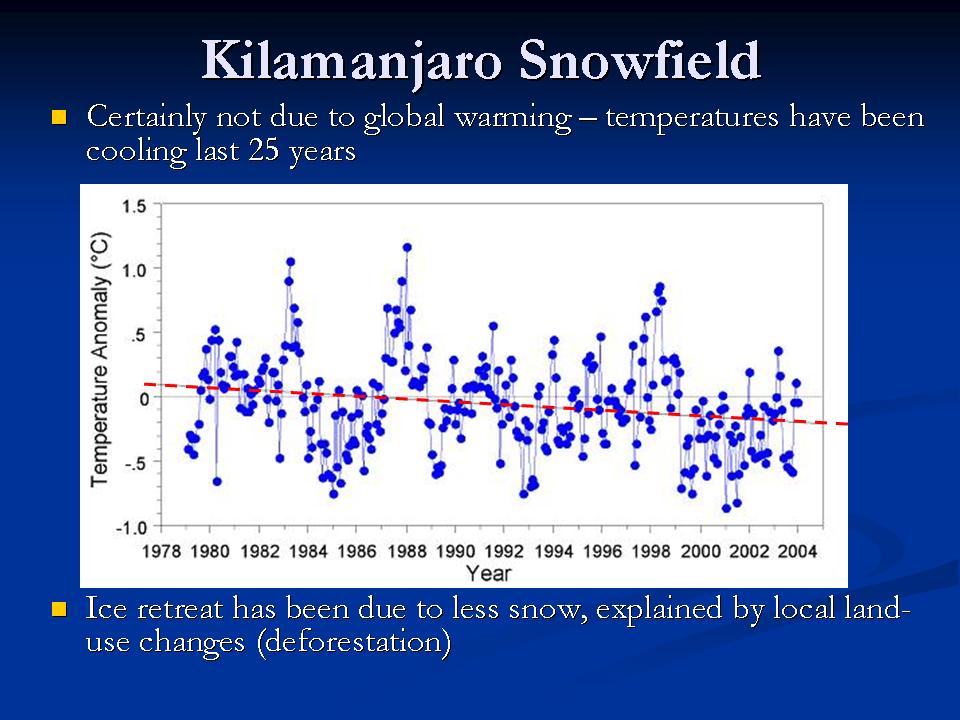
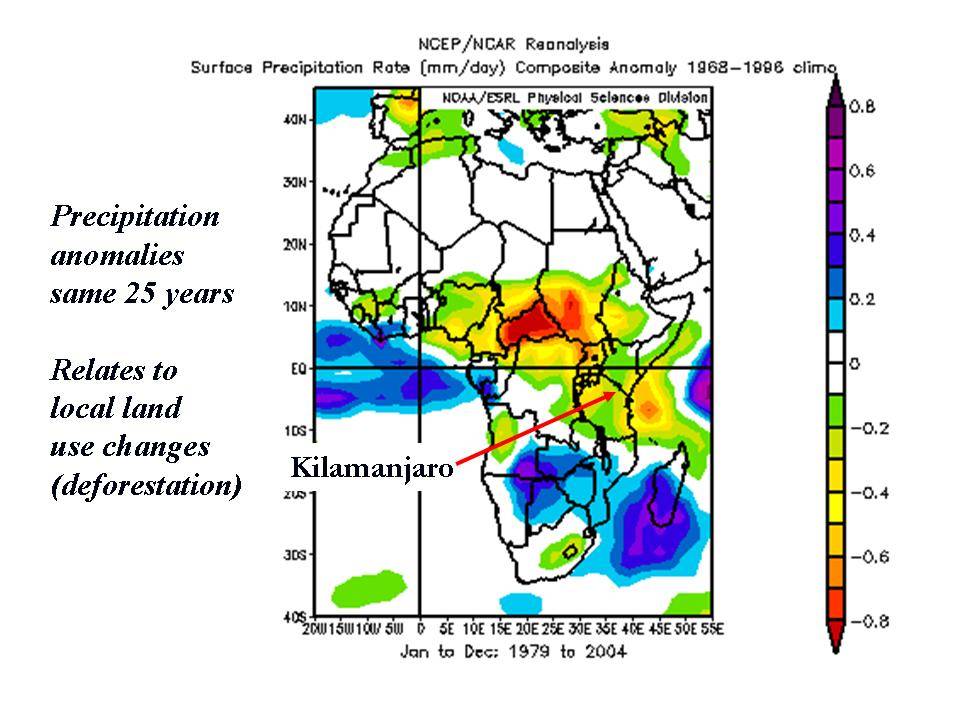
Changes in cloudiness and snowfall may also be involved, though they appear less important, according to the study. (Once again wrong. Thompson sees what he wants to see in the data. But temperatures below and enlarged here have declined at Kilimanjaro not risen and precipitation below and enlarged here has declined due to deforestation and Atlantic Multidecadal changes. Also dust from drier ground is said to be darkening the ice and enhancing the melt.)

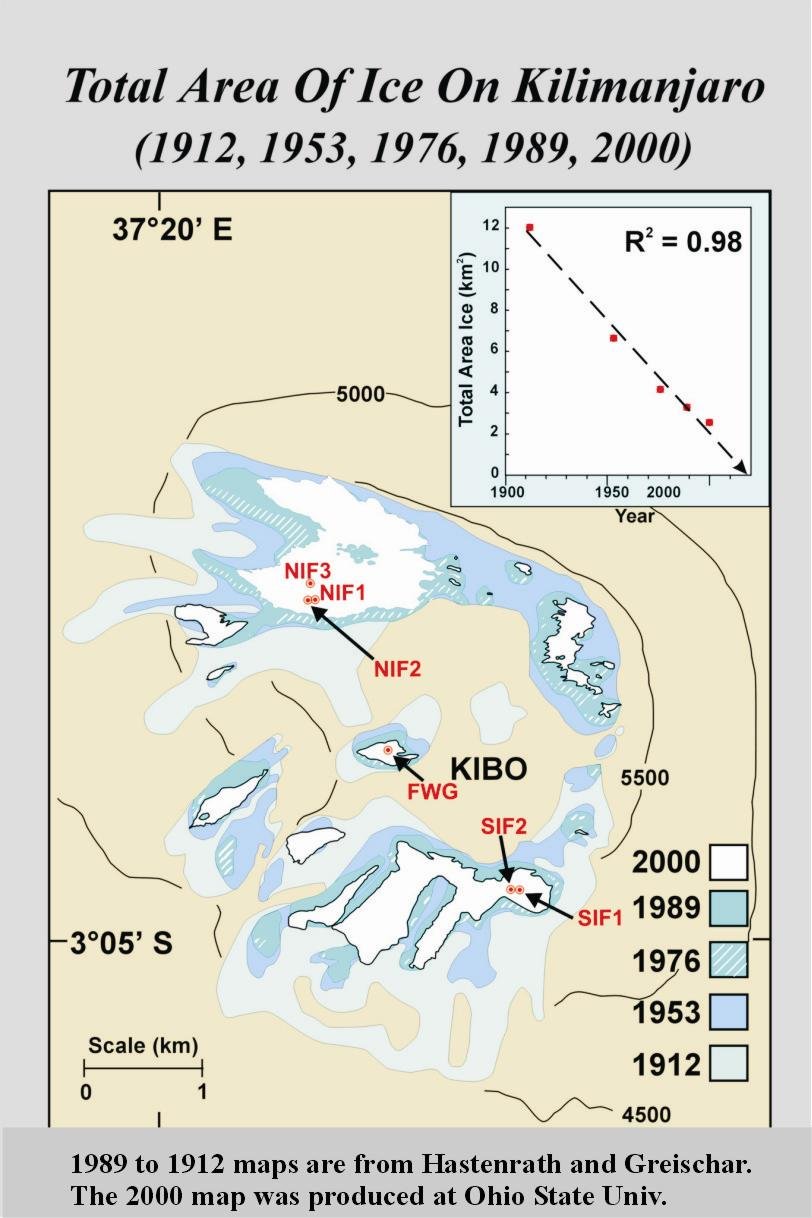
On Kilimanjaro, the researchers said, the northern ice field thinned by 6.2 feet (1.9 meters) and the southern ice field by 16.7 feet (5.1 meters) between 2000 and 2007. Researchers compared the current area covered by the glaciers with maps of the glaciers based on photographs taken in 1912 and 1953 and satellite images from 1976 and 1989. The ‘research’ was funded by the U.S. National Science Foundation and National Oceanic and Atmospheric Administration.
See story timed for Copenhagen by AP here.
Some very interesting additional thoughts and data from Dr. Richard Keen, the University of Colorado.
Ever since I climbed the “shining mountain” 27 years ago I’ve had a deep interest in it, and still keep tabs on the status of Kili’s ice cap. This year another estimate of the ice cap’s area appeared in the literature, and once again I’ve updated my graph.
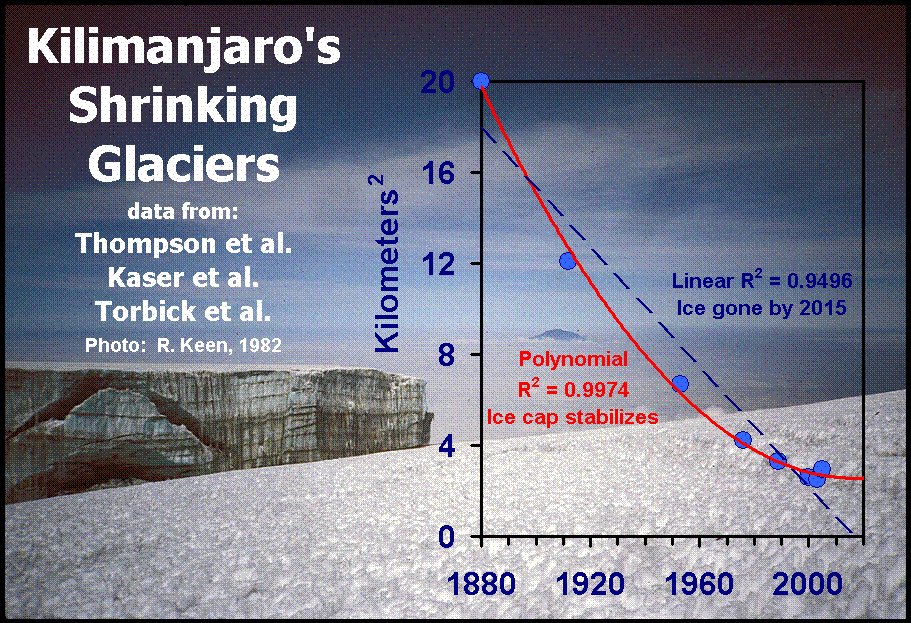
Data from: USGS “Earthshots”:
The 2005 estimate is from Torbick et al., ”Changing Surface Conditions at Kilimanjaro Indicated from Multiscale Imagery”.
Note that the 2005 estimate shows an increase since 2003. I suspect that this increase is not real, but shows the uncertainties of estimating glacier areas from satellite. In any event, the recent measurements do show that the ice loss rate has decreased or even stopped. After 2000, Thompson’s data was linearly extrapolated to predict the glaciers’ complete demise in 2015 or so (see the ”retreat map")
The linear extrapolation has an impressive R2 = 0.98 fit to the observations. However, a second-order polynomial fit gives a much better correlation (R2 = 0.997). While the linear extrapolation predicts the glaciers’ imminent disappearance, the polynomial extrapolation predicts that over the next decade the glaciers’ area should stabilize. The latest observation from Torbick et al. indicates that this may have already happened.
Hemingway’s fabled snows should survive to inspire many more generations of trekkers, and perhaps I’ll just have to go back there to enjoy them!
Dear Mr. and Mrs D’Aleo
Thank you for writing to me about climate change. I appreciate hearing your thoughts on this issue.
I believe that addressing climate change is more than an urgent scientific imperative. It is also tremendous economic opportunity. We have a chance to create millions of new green jobs here at home, and help spark a global recovery that brings clean growth to the developing world and lasting benefits to all of us.
Global climate change is one of the greatest challenges facing the international community today. Right now, the most critical trends and facts all point in the wrong direction. The CO2 emissions that cause climate change grew at a rate four times faster during the Bush Administration than they did in the 1990s. Two years ago, the United Nations Intergovernmental Panel on Climate Change (IPCC) issued a series of projections for global emissions, based on likely energy and land use patterns. Well, today our emissions have actually moved beyond the worst case scenarios predicted by all of the models of the IPCC. Meanwhile, our oceans and forests, which act as natural repositories, are losing their ability to absorb carbon dioxide. This means that the impacts of climate change are being felt stronger than expected, faster than expected.
I believe we must accept the reality of what the science is telling us and act in accordance with the full scope and urgency of this problem. Right now, we have the rare opportunity to avert the climate disaster of tomorrow while helping address our economic challenges of today. Transitioning to a low carbon economy creates tremendous opportunities for economic growth and job creation. Energy is a $6 trillion market with opportunities for innovation and growth that dwarf any other sector. Investments in energy efficiency and renewable produce roughly 3.5 times more jobs per dollar than spending on fossil fuels and green jobs pay 17 percent more than the median national income. We can’t afford not to act.
I’ve been working with the Congress and with the Obama Administration to make reducing U.S. greenhouse gas emissions a top priority. In June 2009, the House of Representatives took a decisive stand and successfully passed the American Clean Energy and Security Act. I am working with my colleagues to pass similar legislation in the Senate. In October 2009, Senator Boxer and I introduced the Clean Energy Jobs and American Power Act (S.1733), which will cut carbon pollution and stimulate the economy by creating millions of jobs in the clean energy sector. Additional information about this bill can be found on my website
As Chairman of the Foreign Relations Committee, I am working closely with the Obama Administration to ensure that the United States takes a leadership role in developing a global agreement to address climate change. In December 2008, I attended the latest round of global climate change negotiations in Poznan, Poland. One resounding message emerged from these meetings: the world is anxiously waiting for the United States to act. In December 2009, the world meets in Copenhagen to negotiate to craft a new global treaty to address climate change. I intend to be there and will do everything I can to assure we have a strong international treaty to be ratified in the Senate.
Please be assured I will continue to fight for significant climate change legislation in the United States as well as an international agreement on climate change in Copenhagen this December.
Again, thank you for your letter. Please do not hesitate to contact me again about this or any other issue of importance to you here.
Please feel free to educate the senator and his staff who obviously don’t have a clue about what is really going on with the climate nor with energy. My guess is you will get the same form letter, but his staff and maybe the senator will have their confidence shattered if they hear from a lot of people. He may not respond if you are not in Massachusetts. if you have a friend there you may wish to send him an email c/o that friend. This will force Kerry’s staff to respond. Be sure to remind him of the failures of the green job movement in Europe - Spain, Denmark and the UK, Germany and in Canada.
Also see this SPPI response to Kerry here.
See how Kerry is wrong w/r to US emissions during the Bush era in this chart by James Taylor, Heartland.
By Joseph D’Aleo, ICECAP
Be in the “Nick” of time to help ICECAP thwart climate change madness that threatens us all!
See below for how your NICKEL can promote a brighter future
Last week it was announced that George Soros pledged $1.1 billion to fund “Climate Change initiatives”. That money will be used to provide strong incentive (TV ads, funding for alarmist web sites, cable special programs and possibly direct financial support (like ENRON tried with Kyoto) to congress and industry barons) to force Cap-and-Tax down our throats and to incent support for a UN treaty that would oblige the US to the US to accept the UN’s view as to how our money should be redistributed globally in reparation for our sins the last century in bringing the world the technological advances it enjoys today.
Meanwhile, while an increasing number of NGOs and organizations are lining up expecting to benefit mightily from Soros et al’s beneficence and our government’s support (another misuse of our tax dollars as we have seen the last decade), most charities that help the poor and needy and non-profit organizations committed to reporting the truth about the environment, energy and the climate are struggling.
People are scared. Those who are employed are finding they have less disposable income, the equity in their homes and their investments have shrunk. More and more families feel loss of disposable income and millions are out of work and in danger of losing their homes and possessions.
If talk radio, cable, non-profit organizations and the internet doesn’t get the word out and stop the madness in DC, taxes will skyrocket and even more people will be out of a job, the dollar’s value will collapse and a super inflationary period like we saw in the 1970s or worse may take place.
Senators from both parties have admitted cap-and-trade is a huge tax, very likely the biggest in history. It is a regressive tax affecting lower and middle income, who can least afford it the most. The administration’s internal memos suggest Cap and Trade would cost families $1,761 a year. The Heritage Foundation estimated a family of four would pay an additional $4,609 per year by 2035, with additional job losses rising to nearly 2.5 million.
Many of us lived through a period a few decades ago with 20% inflation and high unemployment and know what kind of pressure that puts on young families and seniors on fixed income. (I was a young college professor then with small children).
Most charities and non-profit organizations are reportedly struggling as more people hold back on donations. If we don’t get the word out and congress proceeds with their green agenda (for them dollars not the environment), more people will be out of a job, and all of us will be in more of a financial bind than we already are.
ICECAP is a C3 non-profit organization, meaning all contributions are tax deductible. In the early days we received small grants from small think tanks and individuals to get us going. Since then we have been relying mainly on individual donations. We have reached a lot of people here in the United States and indeed the world (25 countries). We have topped 10,250,000 visits to the site over the past and average 125,000 visits per week. We are making a difference and want to do more.
If you use our site regularly please consider a small donation ($20 a year would be just over a nickel a day) to help us spread the REAL truth about climate change.

Every week, Icecap representatives are on the road giving presentations about the hoax of human induced global warming, sometimes traveling long distances at their own expense. As you know, we add dozens of new posts each week (we have over 3500 stories in our searchable cold storage archives). We have assembled a top notch team of volunteer board members who collectively possess a great deal of video production experience that we would like to apply to the creation of videos (DVDs and youtube) and training materials and give more talks. We have a national indeed international network of experts that we can provide material to extend our reach but we need your help. Thank you very much for any financial support, no matter how small, for these efforts and for getting involved in your community by spreading the word to your family, friends, neighbors and your representatives. (PDF)
Donation button is on the left for secure donations through Paypal or write me at jsdaleo@yahoo.com for address if you prefer mail. Remember for US citizens, your donations are tax deductible.
Update: Thank you for your considerable support. We appreciate it.
I was on the agenda at the Southern New England Weather Conference on October 24th along with Kerry Emanuel back to back. Both our presentations should be posted on-line and dnowloadable. We will let you know when. I also participated in an international meeting Climate Change, The Solar Weather Technique and the Future of Forecasting Conference at Imperial College in London on October 28. Here are the opening remarks by Piers Corbyn, We Stand for Evidence Based Science and remarks by Sammy Wilson, DUP MP here.
My powerpoint follows as PDF in two parts: Part 1, Part 2. All the presentations will be available soon here.
By Anthony Watts, Watts Up With That
First the Press Release from Penn University here:
North Carolina Sea Levels Rising Three Times Faster Than in Previous 500 Years, Penn Study Says- October 28, 2009
PHILADELPHIA - An international team of environmental scientists led by the University of Pennsylvania has shown that sea-level rise, at least in North Carolina, is accelerating. Researchers found 20th-century sea-level rise to be three times higher than the rate of sea-level rise during the last 500 years. In addition, this jump appears to occur between 1879 and 1915, a time of industrial change that may provide a direct link to human-induced climate change. The results appear in the current issue of the journal Geology.
The rate of relative sea-level rise, or RSLR, during the 20th century was 3 to 3.3 millimeters per year, higher than the usual rate of one per year. Furthermore, the acceleration appears consistent with other studies from the Atlantic coast, though the magnitude of the acceleration in North Carolina is larger than at sites farther north along the U.S. and Canadian Atlantic coast and may be indicative of a latitudinal trend related to the melting of the Greenland ice sheet.
Understanding the timing and magnitude of this possible acceleration in the rate of RSLR is critical for testing models of global climate change and for providing a context for 21st-century predictions.
“Tide gauge records are largely inadequate for accurately recognizing the onset of any acceleration of relative sea-level rise occurring before the 18th century, mainly because too few records exist as a comparison,” Andrew Kemp, the paper’s lead author, said. “Accurate estimates of sea-level rise in the pre-satellite era are needed to provide an appropriate context for 21st-century projections and to validate geophysical and climate models.”
The research team studied two North Carolina salt marshes that form continuous accumulations of organic sediment, a natural archive that provides scientists with an accurate way to reconstruct relative sea levels using radiometric isotopes and stratigraphic age markers. The research provided a record of relative sea-level change since the year 1500 at the Sand Point and Tump Point salt marshes in the Albemarle-Pamlico estuarine system of North Carolina. The two marshes provided an ideal setting for producing high-resolution records because thick sequences of high marsh sediment are present and the estuarine system is microtidal, which reduces the vertical uncertainty of paleosea-level estimates. The study provides for the first time replicated sea-level reconstructions from two nearby sites.
In addition, comparison with 20th-century tide-gauge records validates the use of this approach and suggests that salt-marsh records with decadal and decimeter resolution can supplement tide-gauge records by extending record length and compensating for the strong spatial bias in the global distribution of longer instrumental records.
The study was funded by the National Oceanic and Atmospheric Administration Coastal Ocean Program, North Carolina Coastal Geology Cooperative Program, U.S. Geological Survey and National Science Foundation.
-------------------------------
I was curious, because this seemed a bit “off” to me based on other data that I’ve seen. So I went to the University of Colorado Sea Level data server and entered the coordinates for Albemarle Sound (36N -76W or in their usage 36N 284W). The graph they serve up looks like this:

It’s low resolution, but does look rather flat. Fortunately they provide the data with the plot. You can read all about the Topex/Poseidon data preparation here. I took that raw data and plotted it here in an expanded size and did a trend line, shown below:

Click here for larger image.
The result was surprising. A slight negative trend.
I chose a different location to get closer to Pamlico Sound, also cited in the study. Unfortunately the interactive tool at UC is coarse on lat/lon and the closest I could get was 35N -76W, just off the outer banks. The data from that point is plotted below. The source data for 35N -76W is available here.

Click here for a larger image.
Apologies for the slight cosmetic differences in line size between the two graphs. I had a computer reset between sessions and lost some settings. So, if there is 3mm rise per year recently, since 1992, we certainly can’t see it. I can’t say anything for the other years in the study. But in the press release they say:
The rate of relative sea-level rise, or RSLR, during the 20th century was 3 to 3.3 millimeters per year, higher than the usual rate of one per year. If that is true, then the rate appears to have slowed significantly in the late 20th century to present. For 35N, -76W, the 1.12mm/yr rate certainly looks like the “usual rate of one per year”. See full post and comments here.
By William M. Briggs, Statistician to the Stars

“J’accuse! A statistician may prove anything with his nefarious methods. He may even say a negative number is positive! You cannot trust anything he says.
Sigh. Unfortunately, this oft-hurled charge is all too true. I and my fellow statisticians must bear its sad burden, knowing it is caused by our more zealous brethren (and sisthren). But, you know, it really isn’t their fault, for they are victims of loving not wisely but too well their own creations.
First, a fact. It is true that, based on the observed satellite data, average global temperatures since about 1998 have not continued the rough year-by-year increase that had been noticed in the decade or so before that date. The temperatures since about 1998 have increased in some years, but more often have they decreased. For example, last year was cooler than the year before last. These statements, barring unknown errors in the measurement of that data, are taken as true by everybody, even statisticians.
The AP gave this data - concealing its source - to “several independent statisticians” who said they “found no true temperature declines over time” (link)
How can this be? Why would a statistician say that the observed cooling is not “scientifically legitimate”; and why would another state that noticing the cooling “is a case of ‘people coming at the data with preconceived notions’”?
Are these statisticians, since they are concluding the opposite of what has been observed, insane? This is impossible: statisticians are highly lucid individuals, its male members exceedingly handsome and charming. Perhaps they are rabid environmentalists who care nothing for truth? No, because none of them knew the source of the data they were analyzing. What can account for this preposterous situation!
Love. The keen pleasures of their own handiwork. That is, the adoration of lovingly crafted models.
Let me teach you to be a classical statistician. Go to your favorite climate site and download a time series picture of the satellite-derived temperature (so that we have no complications from mixing of different data sources); any will do. Here’s one from our pal Anthony Watts.
Now fetch a ruler - a straight edge - preferably one with which you have an emotional attachment. Perhaps the one your daughter used in kindergarten. The only proviso is that you must love the ruler.
Place the ruler on the temperature plot and orient it along the data so that it most pleases your eye. Grab a pencil and draw a line along its edge. Then, if you can, erase all the original temperature points so that all you are left with is the line you drew.
If a reporter calls and asks if the temperature was warmer or colder last year, do not use the original data, which of course you cannot since you erased it, but use instead your line. According to that very objective line the temperature has obviously increased. Insist on the scientificity of that line - say that according to its sophisticated inner-methodology, the pronouncement must be that the temperature has gone up! Even though, in fact, it has gone down.
Don’t laugh yet, dear ones. That analogy is too close to the truth. The only twist is that statisticians don’t use a ruler to draw their lines - some use a hockey stick. Just kidding! (Now you can laugh.) Instead, they use the mathematical equivalent of rulers and other flexible lines.
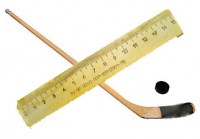
Your ruler is a model Statisticians are taught - their entire training stresses - that data isn’t data until it is modeled. Those temperatures don’t attain significance until a model can be laid over the top of them. Further, it is our credo to, in the end, ignore the data and talk solely of the model and its properties. We love models!
All this would be OK, except for one fact that is always forgotten. For any set of data, there are always an infinite number of possible models. Which is the correct one? Which indeed!
Many of these models will say the temperature has gone down, just as others will say that it has gone up. The AP statisticians used models most familiar to them; like “moving averages of about 10 years” (moving average is the most used method of replacing actual data with a model in time series); or “trend” models, which are distinct cousins to rulers.
Since we are free to choose from an infinite bag, all of our models are suspect and should not be trusted until they have proven their worth by skillfully predicting data that has not yet been seen. None of the models in the AP study have done so. Even stronger, since they said temperatures were higher when they were in fact lower, they must predict higher temperatures in the coming years, a forecast which few are making.
We are too comfortable with this old way of doing things. We really can prove anything we want with careful choice of models.
Read more here.
’Warming had a natural origin...CO2 is ‘not guilty’
Reprint of new scientific paper: (Full pdf paper available here.)
THE SUN DEFINES THE CLIMATE
By Habibullo Abdussamatov, Dr. Sc. - Head of Space research laboratory of the Pulkovo Observatory
Key Excerpts: Observations of the Sun show that as for the increase in temperature, carbon dioxide is “not guilty” and as for what lies ahead in the upcoming decades, it is not catastrophic warming, but a global, and very prolonged, temperature drop. [...] Over the past decade, global temperature on the Earth has not increased; global warming has ceased, and already there are signs of the future deep temperature drop. [...] It follows that warming had a natural origin, the contribution of CO2 to it was insignificant, anthropogenic increase in the concentration of carbon dioxide does not serve as an explanation for it, and in the foreseeable future CO2 will not be able to cause catastrophic warming. The so-called greenhouse effect will not avert the onset of the next deep temperature drop, the 19th in the last 7500 years, which without fail follows after natural warming. [...] We should fear a deep temperature drop—not catastrophic global warming. Humanity must survive the serious economic, social, demographic and political consequences of a global temperature drop, which will directly affect the national interests of almost all countries and more than 80% of the population of the Earth. A deep temperature drop is a considerably greater threat to humanity than warming. However, a reliable forecast of the time of the onset and of the depth of the global temperature drop will make it possible to adjust in advance the economic activity of humanity, to considerably weaken the crisis.
Experts of the United Nations in regular reports publish data said to show that the Earth is approaching a catastrophic global warming, caused by increasing emissions of carbon dioxide to the atmosphere. However, observations of the Sun show that as for the increase in temperature, carbon dioxide is “not guilty” and as for what lies ahead in the upcoming decades, it is not catastrophic warming, but a global, and very prolonged, temperature drop.
Life on earth completely depends on solar radiation, the ultimate source of energy for natural processes. For a long time it was thought that the luminosity of the Sun never changes, and for this reason the quantity of solar energy received per second over one square meter above the atmosphere at the distance of the Earth from the Sun (149,597,892 km), was named the solar constant.
Until 1978, precise measurements of the value of the total solar irradiance (TSI) were not available. But according to indirect data, namely the established major climate variations of the Earth in recent millennia, one must doubt the invariance of its value.
In the middle of the nineteenth century, German and Swiss astronomers Heinrich Schwabe and Rudolf Wolf established that the number of spots on the surface of the Sun periodically changes, diminishing from a maximum to a minimum, and then growing again, over a time frame on the order of 11 years. Wolf introduced an index ("W") of the relative number of sunspots, computed as the sum of 10 times number of sunspot groups plus the total number of spots in all groups. This number has been regularly measured since 1849. Drawing on the work of professional astronomers and the observations of amateurs (which are of uncertain reliability) Wolf worked out a reconstruction of monthly values from 1749 as well as annual values from 1700. Today, the reconstruction of this time series stretches back to 1611. It has an eleven-year cycle of recurrence as well as other cycles related to onset and development of individual sunspot groups: changes in the fraction of the solar surface occupied by faculae, the frequency of prominences, and other phenomena in the solar chromosphere and corona.
Analyzing the long record of sunspot numbers, the English astronomer Walter Maunder in 1893 came to the conclusion that from 1645 to 1715 sunspots had been generally absent. Over the thirty-year period of the Maunder Minimum, astronomers of the time counted only about 50 spots. Usually, over that length of time, about 50,000 sunspots would appear. Today, it has been established that such minima have repeatedly occurred in the past. It is also known that the Maunder Minimum accompanied the coldest phase of a global temperature dip, physically measured in Europe and other regions, the most severe such dip for several millennia, which stretched from the fourteenth to the nineteenth centuries (now known as the Little Ice Age).
The search for a relationship between large climate variations and phenomena observed in the Sun led to an interest in finding a connection between periods of change in the terrestrial climate and corresponding significant changes in the level of observed solar activity, because the sunspot number is the only index that has been measured over a long period of time.
Determinative role of the Sun in variations in the climate of the Earth
The Earth, after receiving and storing over the twentieth century an anomalously large amount of heat energy, from the 1990’s began to return it gradually. The upper layers of the world ocean, completely unexpectedly to climatologists, began to cool in 2003. The heat accumulated by them unfortunately now is running out. Over the past decade, global temperature on the Earth has not increased; global warming has ceased, and already there are signs of the future deep temperature drop. Meantime the concentration of carbon dioxide in the atmosphere over these years has grown by more than 4%, and in 2006 many meteorologists predicted that 2007 would be the hottest of the last decade. This did not occur, although the global temperature of the Earth would have increased at least 0.1 degree if it depended on the concentration of carbon dioxide. It follows that warming had a natural origin, the contribution of CO2 to it was insignificant, anthropogenic increase in the concentration of carbon dioxide does not serve as an explanation for it, and in the foreseeable future CO2 will not be able to cause catastrophic warming. The so-called greenhouse effect will not avert the onset of the next deep temperature drop, the 19th in the last 7500 years, which without fail follows after natural warming.
The earth is no longer threatened by the catastrophic global warming forecast by some scientists; warming passed its peak in 1998-2005, while the value of the TSI by July - September of last year had already declined by 0.47 W/m2.
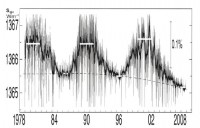
For several years until the beginning in 2013 of a steady temperature drop, in a phase of instability, temperature will oscillate around the maximum that has been reached, without further substantial rise. Changes in climatic conditions will occur unevenly, depending on latitude. A temperature decrease in the smallest degree would affect the equatorial regions and strongly influence the temperate climate zones. The changes will have very serious consequences, and it is necessary to begin preparations even now, since there is practically no time in reserve. The global temperature of the Earth has begun its decrease without limitations on the volume of greenhouse gas emissions by industrially developed countries; therefore the implementation of the Kyoto protocol aimed to rescue the planet from the greenhouse effect should be put off at least 150 years.

Consequently, we should fear a deep temperature drop—not catastrophic global warming. Humanity must survive the serious economic, social, demographic and political consequences of a global temperature drop, which will directly affect the national interests of almost all countries and more than 80% of the population of the Earth. A deep temperature drop is a considerably greater threat to humanity than warming. However, a reliable forecast of the time of the onset and of the depth of the global temperature drop will make it possible to adjust in advance the economic activity of humanity, to considerably weaken the crisis. See more here.
Pacific Island Sea Levels Are Not RisingBy Dr. Vincent Gray, NZ Climate Truth Newsletter
We are daily told that Paific Islands are “threatened” with rising sea levels. Yet many estasblished measurements, for example in Tuvalu, do not agree.
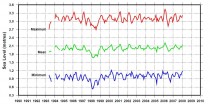
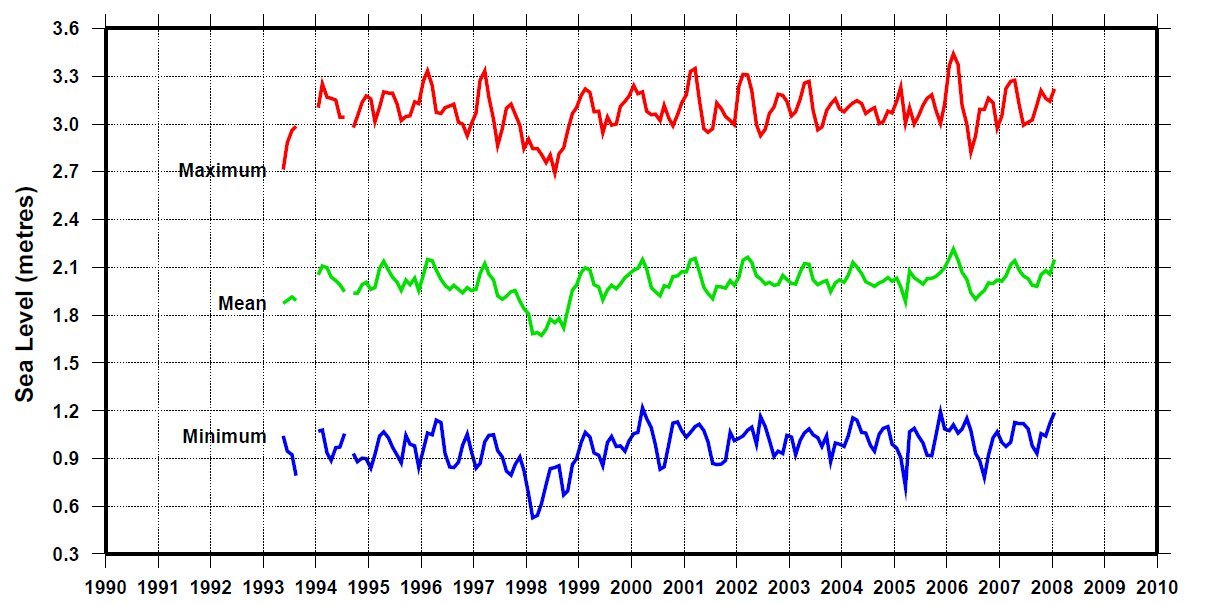
In 1990 the Australian Government became so worried about the obstinacy of the measurements that they launched The South Pacific Sea Level and Climate Monitoring Project (SPSLCMP0. This has placed the most sophisticated equipment ever developed (SEAFRAME) on 12 Pacific Islands Cook Islands, Federated States of Micronesia (only from 2003), Fiji, Kiribati, Marshall Islands, Nauru, Papua New Guinea, Samoa, Solomon Islands, Tonga, Tuvalu, and Vanuatu. The results are so startling that they have never been published in “peer reviewed” Journals and are only available on the websites . The main one is here although they try to rediredct you to the following site which provides the message “This page cannot be found”
A summary of the results was preesented by Philip Hall in 2006 here. However, this does not provide any of the actual records. It provides alleged “trends”, which are misleading.
The actual records can be found here. There are 12 seperate Reports, one for each island. They all contain the same initial section, which is concentrated in claiming that there are upward “trends” in sea level in every island. Only at the end do you get the a record of actual measurements by the SEAFRAME equipment, but only for that particular island. If you want to see all the records and compare them you have to download the twelve seperate Reports. .
My Report “South Pacific Sea Level: a Reassessment” here is the only paper which collects all of the actual measurements of sea level on all twelve islands.
The records all show a degree of irregularity. The seasonal change is present in all. The main irregularity is associated with the Tropical Cyclones and Tsunamis that affected all the islands at some time during the SEAFRAME measurements, which are usually since 1991. The dates of the cyclones and tsunamis for that particular island are given in each Report. The 1998 El Niño cyclones are present on nearly all of them. They caused a depression in sea level which may be an artefact, due to disturbance of the region close to the instruments. They also seem to cause a slight jump in the measurementl which could be due to a disturbance in the level of the instrument. With Fiji, Nauru, Samoa, Solomons, Tonga, the measurement jumped slight;y upwards after the hurricane It seems very likely that the hurricane disturbed the equipment. In the year 2000 all of the instruments were equipped with an up-todate Global Positioning system, so the measurements after that date are the most reliable.
The anonymous scientists involved showed there were upwards “trends” based entirely on a linear regression on the whole series, including the first one or two figures, which could be influenced by teething troubles, and the disturbances caused by cyclones and tsunamis, They failed to notice that after the Global Poitioning equipment was installed in the year 2000 eleven of the twelve islands showed no change in sea level. Kiribati and Nauru showed no change since 1993, Cooks, Marshalls and Tuvalu since 1994, Papue New Guinea and Vanuatu since 1995. The Fedrated Stes of Micrnesia, starting in 2002, showed no change after 2003.
I conclude that the South Pacific Sea Level and Climate Monitoring Project has provided unequivocal evidence that sea level is not rising near any of the Pacific islands, and that they are not “threatened” in the way claimed.
It will be interesting to see what happens to the measurements as a result of the recent tsunamis. I would be glad to send my paper to anybody interested, but I thought I could hardly send all twelve records here. I have attached Tuvalu, which is persistently claimed to be sinking.
The question arises, is it typical? I think it quite likely that the phenomena shown here, of disturbance to equipment when subjected to hurricanes or severe weather, may be responsible for many of the records showing sudden upward jumps. The records are also subject to neighbouring land subsidence due to weight of buildins and removal of ground water and minerals. .
Many records begin to level off as soon as they install GPS; for example, Auckland (below)
The Topex/Poseidon/Jason satelite series shows a riise of sea level since 1993 but it has levelled out since 2006 , It might be subject to ocean oscillations more than sites adjacent to the land, which after all, are what matters to people who live there.